|
Download Data (XLS File) |
|
||||||||
|
||||||||
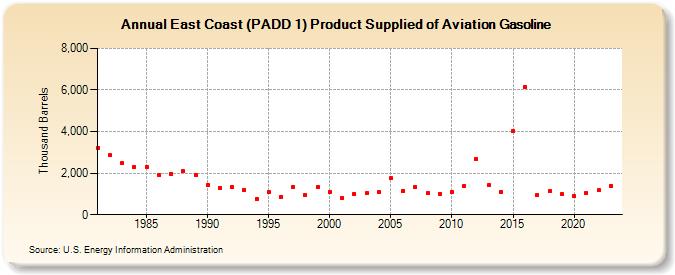
| East Coast (PADD 1) Product Supplied of Aviation Gasoline (Thousand Barrels) | ||||||||
| Decade | Year-0 | Year-1 | Year-2 | Year-3 | Year-4 | Year-5 | Year-6 | Year-7 | Year-8 | Year-9 |
|---|---|---|---|---|---|---|---|---|---|---|
| 1980's | 3,224 | 2,858 | 2,475 | 2,284 | 2,308 | 1,901 | 1,975 | 2,079 | 1,889 | |
| 1990's | 1,410 | 1,306 | 1,315 | 1,190 | 759 | 1,089 | 854 | 1,354 | 940 | 1,337 |
| 2000's | 1,105 | 816 | 1,019 | 1,028 | 1,079 | 1,748 | 1,164 | 1,323 | 1,039 | 1,020 |
| 2010's | 1,115 | 1,387 | 2,676 | 1,427 | 1,096 | 4,022 | 6,136 | 950 | 1,132 | 984 |
| 2020's | 904 | 1,049 | 1,172 | 1,390 |
| - = No Data Reported; -- = Not Applicable; NA = Not Available; W = Withheld to avoid disclosure of individual company data. |
| Release Date: 4/30/2024 |
| Next Release Date: 8/30/2024 |