|
Download Data (XLS File) |
|
||||||||
|
||||||||
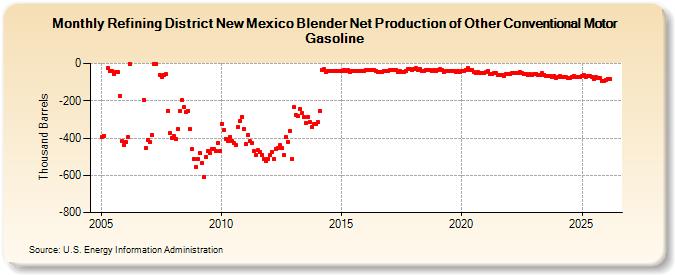
| Refining District New Mexico Blender Net Production of Other Conventional Motor Gasoline (Thousand Barrels) | ||||||||
| Year | Jan | Feb | Mar | Apr | May | Jun | Jul | Aug | Sep | Oct | Nov | Dec |
|---|---|---|---|---|---|---|---|---|---|---|---|---|
| 2005 | -392 | -387 | -25 | -43 | -43 | -59 | -47 | -46 | -175 | -416 | -438 | |
| 2006 | -422 | -394 | -1 | -194 | -451 | -408 | ||||||
| 2007 | -424 | -386 | -2 | -1 | -61 | -71 | -61 | -58 | -255 | -372 | -398 | |
| 2008 | -390 | -406 | -354 | -257 | -196 | -234 | -262 | -255 | -352 | -459 | -511 | -557 |
| 2009 | -511 | -480 | -533 | -609 | -503 | -471 | -482 | -460 | -459 | -471 | -425 | -471 |
| 2010 | -324 | -356 | -403 | -414 | -393 | -414 | -429 | -438 | -341 | -309 | -287 | -350 |
| 2011 | -433 | -384 | -418 | -428 | -470 | -492 | -466 | -474 | -489 | -515 | -523 | -511 |
| 2012 | -493 | -475 | -512 | -460 | -452 | -440 | -454 | -490 | -394 | -419 | -362 | -510 |
| 2013 | -235 | -276 | -280 | -244 | -267 | -289 | -318 | -285 | -315 | -342 | -325 | -325 |
| 2014 | -315 | -256 | -34 | -31 | -45 | -38 | -40 | -43 | -38 | -43 | -41 | -42 |
| 2015 | -40 | -34 | -38 | -37 | -44 | -40 | -43 | -40 | -38 | -40 | -39 | -41 |
| 2016 | -35 | -34 | -33 | -37 | -35 | -40 | -47 | -45 | -44 | -41 | -40 | -38 |
| 2017 | -33 | -33 | -36 | -36 | -44 | -41 | -44 | -44 | -38 | -31 | -29 | -34 |
| 2018 | -30 | -24 | -34 | -27 | -39 | -38 | -37 | -35 | -36 | -40 | -35 | -40 |
| 2019 | -33 | -32 | -34 | -44 | -39 | -41 | -38 | -42 | -40 | -45 | -39 | -47 |
| 2020 | -40 | -38 | -36 | -23 | -33 | -34 | -48 | -53 | -46 | -50 | -53 | -49 |
| 2021 | -47 | -40 | -58 | -59 | -52 | -50 | -62 | -64 | -60 | -65 | -59 | -56 |
| 2022 | -57 | -51 | -53 | -52 | -53 | -44 | -51 | -54 | -54 | -61 | -57 | -61 |
| 2023 | -58 | -53 | -61 | -62 | -53 | -62 | -68 | -66 | -65 | -71 | -67 | -76 |
| 2024 | -74 | |||||||||||
| - = No Data Reported; -- = Not Applicable; NA = Not Available; W = Withheld to avoid disclosure of individual company data. |
| Release Date: 3/29/2024 |
| Next Release Date: 4/30/2024 |