|
Download Data (XLS File) |
|
||||||||
|
||||||||
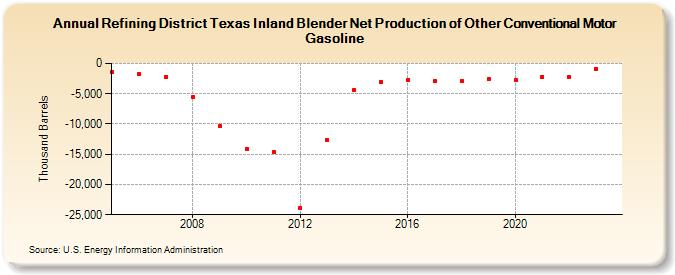
| Refining District Texas Inland Blender Net Production of Other Conventional Motor Gasoline (Thousand Barrels) | ||||||||
| Decade | Year-0 | Year-1 | Year-2 | Year-3 | Year-4 | Year-5 | Year-6 | Year-7 | Year-8 | Year-9 |
|---|---|---|---|---|---|---|---|---|---|---|
| 2000's | -1,470 | -1,679 | -2,161 | -5,464 | -10,351 | |||||
| 2010's | -14,135 | -14,616 | -23,885 | -12,567 | -4,355 | -3,006 | -2,725 | -2,869 | -2,829 | -2,553 |
| 2020's | -2,750 | -2,182 | -2,247 | -857 |
| - = No Data Reported; -- = Not Applicable; NA = Not Available; W = Withheld to avoid disclosure of individual company data. |
| Release Date: 3/29/2024 |
| Next Release Date: 8/30/2024 |