|
Download Data (XLS File) |
|
||||||||
|
||||||||
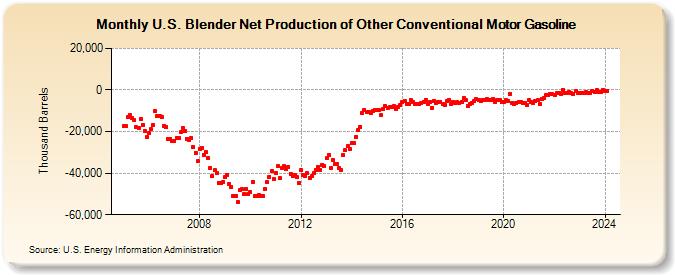
| U.S. Blender Net Production of Other Conventional Motor Gasoline (Thousand Barrels) | ||||||||
| Year | Jan | Feb | Mar | Apr | May | Jun | Jul | Aug | Sep | Oct | Nov | Dec |
|---|---|---|---|---|---|---|---|---|---|---|---|---|
| 2005 | -17,390 | -17,469 | -13,014 | -12,018 | -13,516 | -14,451 | -17,959 | -18,076 | -14,044 | -16,702 | -19,500 | -22,580 |
| 2006 | -20,797 | -18,978 | -16,936 | -10,325 | -12,757 | -12,629 | -12,800 | -17,200 | -17,843 | -23,680 | -23,442 | -24,753 |
| 2007 | -24,398 | -23,079 | -23,208 | -20,405 | -18,392 | -19,504 | -23,365 | -24,066 | -23,103 | -27,502 | -30,161 | -34,288 |
| 2008 | -28,345 | -27,746 | -31,068 | -30,060 | -32,866 | -37,321 | -41,614 | -38,683 | -39,857 | -44,572 | -44,761 | -44,312 |
| 2009 | -42,027 | -40,847 | -45,050 | -46,484 | -50,846 | -50,924 | -53,768 | -48,246 | -47,819 | -50,250 | -47,638 | -50,105 |
| 2010 | -49,192 | -44,350 | -51,157 | -51,045 | -50,641 | -51,063 | -51,190 | -47,799 | -44,396 | -41,641 | -39,183 | -43,058 |
| 2011 | -39,855 | -36,749 | -42,368 | -37,301 | -36,705 | -37,903 | -37,098 | -40,199 | -41,401 | -41,127 | -42,043 | -44,797 |
| 2012 | -38,608 | -41,106 | -41,589 | -40,102 | -42,110 | -41,437 | -40,078 | -38,465 | -37,000 | -38,392 | -36,009 | -36,462 |
| 2013 | -32,932 | -31,254 | -37,512 | -33,808 | -35,692 | -35,442 | -37,700 | -38,510 | -31,385 | -29,034 | -27,119 | -28,224 |
| 2014 | -25,631 | -25,534 | -22,462 | -19,239 | -17,683 | -11,124 | -9,557 | -10,698 | -10,547 | -11,075 | -10,130 | -9,774 |
| 2015 | -9,498 | -9,870 | -12,182 | -8,936 | -7,826 | -8,652 | -8,384 | -7,960 | -7,789 | -8,925 | -7,992 | -7,147 |
| 2016 | -5,738 | -5,407 | -6,604 | -6,737 | -4,624 | -5,960 | -6,523 | -6,589 | -6,789 | -6,167 | -5,641 | -4,798 |
| 2017 | -6,706 | -5,730 | -8,484 | -5,160 | -6,182 | -5,575 | -5,613 | -6,829 | -7,066 | -5,534 | -4,585 | -6,874 |
| 2018 | -5,668 | -6,098 | -5,822 | -6,248 | -5,879 | -3,835 | -4,960 | -7,551 | -6,860 | -6,098 | -5,144 | -4,364 |
| 2019 | -4,840 | -5,162 | -4,685 | -4,790 | -4,452 | -4,884 | -5,033 | -4,320 | -5,837 | -5,063 | -4,701 | -5,950 |
| 2020 | -5,968 | -4,897 | -5,299 | -1,803 | -6,069 | -6,721 | -6,469 | -5,648 | -5,625 | -6,202 | -6,505 | -7,051 |
| 2021 | -4,987 | -5,643 | -6,369 | -5,492 | -4,912 | -6,672 | -4,122 | -4,085 | -2,657 | -2,572 | -1,834 | -1,843 |
| 2022 | -2,593 | -1,667 | -1,341 | -1,844 | 178 | -1,367 | -1,508 | -858 | -1,426 | -1,731 | -601 | -1,568 |
| 2023 | -1,176 | -1,327 | -1,148 | -899 | -1,310 | -1,267 | -713 | -995 | -71 | -1,150 | -951 | 126 |
| 2024 | -467 | -312 | -1,902 | -1,303 | -1,555 | -2,197 | ||||||
| - = No Data Reported; -- = Not Applicable; NA = Not Available; W = Withheld to avoid disclosure of individual company data. |
| Release Date: 8/30/2024 |
| Next Release Date: 9/30/2024 |