|
Download Data (XLS File) |
|
||||||||
|
||||||||
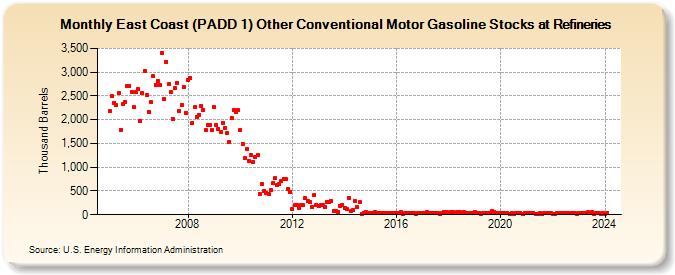
| East Coast (PADD 1) Other Conventional Motor Gasoline Stocks at Refineries (Thousand Barrels) | ||||||||
| Year | Jan | Feb | Mar | Apr | May | Jun | Jul | Aug | Sep | Oct | Nov | Dec |
|---|---|---|---|---|---|---|---|---|---|---|---|---|
| 2005 | 2,173 | 2,488 | 2,361 | 2,306 | 2,553 | 1,785 | 2,323 | 2,373 | 2,712 | 2,714 | 2,580 | 2,257 |
| 2006 | 2,584 | 2,635 | 1,974 | 2,563 | 3,031 | 2,515 | 2,155 | 2,364 | 2,909 | 2,740 | 2,814 | 2,737 |
| 2007 | 3,405 | 2,442 | 3,222 | 2,741 | 2,578 | 2,017 | 2,659 | 2,781 | 2,184 | 2,314 | 2,692 | 2,143 |
| 2008 | 2,840 | 2,873 | 1,936 | 2,260 | 2,065 | 2,101 | 2,289 | 2,208 | 1,785 | 1,886 | 1,897 | 1,777 |
| 2009 | 2,259 | 1,886 | 1,814 | 1,747 | 1,934 | 1,828 | 1,720 | 1,538 | 2,033 | 2,200 | 2,171 | 2,211 |
| 2010 | 1,787 | 1,486 | 1,190 | 1,381 | 1,137 | 1,247 | 1,106 | 1,208 | 1,247 | 437 | 643 | 508 |
| 2011 | 464 | 437 | 516 | 661 | 765 | 615 | 645 | 702 | 754 | 745 | 546 | 483 |
| 2012 | 111 | 199 | 202 | 142 | 207 | 196 | 342 | 289 | 271 | 171 | 406 | 213 |
| 2013 | 193 | 201 | 199 | 154 | 275 | 262 | 292 | 73 | 73 | 67 | 179 | 206 |
| 2014 | 145 | 122 | 362 | 70 | 108 | 286 | 155 | 267 | 25 | 42 | 49 | 42 |
| 2015 | 46 | 37 | 49 | 26 | 39 | 46 | 35 | 33 | 41 | 32 | 32 | 31 |
| 2016 | 46 | 44 | 55 | 16 | 34 | 26 | 38 | 39 | 40 | 25 | 28 | 31 |
| 2017 | 45 | 29 | 54 | 38 | 43 | 28 | 44 | 40 | 25 | 33 | 59 | 49 |
| 2018 | 42 | 52 | 47 | 27 | 47 | 48 | 44 | 49 | 33 | 46 | 41 | 42 |
| 2019 | 49 | 46 | 44 | 22 | 28 | 36 | 44 | 40 | 70 | 57 | 40 | 38 |
| 2020 | 30 | 28 | 45 | 28 | 24 | 34 | 23 | 36 | 26 | 46 | 25 | 34 |
| 2021 | 31 | 41 | 38 | 31 | 17 | 25 | 32 | 20 | 29 | 33 | 35 | 36 |
| 2022 | 22 | 23 | 29 | 27 | 28 | 41 | 26 | 29 | 43 | 44 | 33 | 19 |
| 2023 | 42 | 37 | 31 | 37 | 51 | 28 | 56 | 24 | 43 | 32 | 21 | 34 |
| 2024 | 25 | |||||||||||
| - = No Data Reported; -- = Not Applicable; NA = Not Available; W = Withheld to avoid disclosure of individual company data. |
| Release Date: 3/29/2024 |
| Next Release Date: 4/30/2024 |