|
Download Data (XLS File) |
|
||||||||
|
||||||||
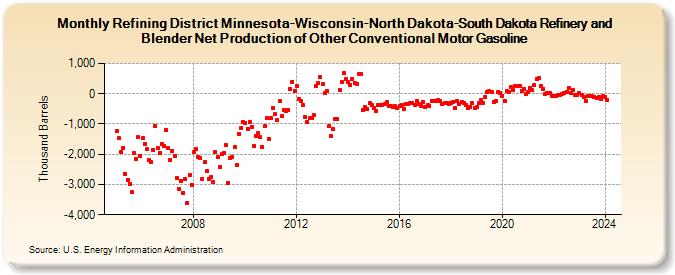
| Refining District Minnesota-Wisconsin-North Dakota-South Dakota Refinery and Blender Net Production of Other Conventional Motor Gasoline (Thousand Barrels) | ||||||||
| Year | Jan | Feb | Mar | Apr | May | Jun | Jul | Aug | Sep | Oct | Nov | Dec |
|---|---|---|---|---|---|---|---|---|---|---|---|---|
| 2005 | -1,227 | -1,478 | -1,919 | -1,801 | -2,646 | -2,836 | -3,001 | -3,258 | -1,947 | -2,158 | -1,427 | -2,043 |
| 2006 | -1,477 | -1,669 | -1,830 | -2,186 | -2,260 | -1,860 | -1,071 | -1,800 | -1,944 | -1,658 | -1,716 | -1,185 |
| 2007 | -1,795 | -2,206 | -1,886 | -2,067 | -2,778 | -3,140 | -2,885 | -3,270 | -2,829 | -3,600 | -2,675 | -3,025 |
| 2008 | -1,931 | -1,820 | -2,081 | -2,126 | -2,807 | -2,263 | -2,563 | -2,835 | -2,759 | -2,931 | -1,930 | -2,103 |
| 2009 | -2,409 | -2,006 | -1,962 | -1,701 | -2,937 | -2,117 | -2,088 | -1,776 | -2,364 | -1,334 | -1,131 | -948 |
| 2010 | -971 | -1,150 | -920 | -1,090 | -1,725 | -1,384 | -1,312 | -1,438 | -1,751 | -1,081 | -817 | -1,485 |
| 2011 | -798 | -480 | -672 | -854 | -250 | -750 | -525 | -566 | -542 | 165 | 402 | 106 |
| 2012 | 258 | -171 | -243 | -387 | -776 | -927 | -811 | -792 | -699 | 245 | 350 | 544 |
| 2013 | 308 | 20 | 99 | -1,076 | -1,399 | -1,179 | -843 | -847 | 136 | 379 | 676 | 476 |
| 2014 | 380 | 302 | 487 | 348 | 332 | 647 | 652 | -543 | -443 | -506 | -320 | -383 |
| 2015 | -473 | -576 | -365 | -383 | -373 | -351 | -288 | -399 | -415 | -431 | -419 | -462 |
| 2016 | -403 | -371 | -514 | -324 | -352 | -313 | -301 | -369 | -244 | -337 | -392 | -273 |
| 2017 | -443 | -380 | -398 | -237 | -240 | -244 | -204 | -248 | -339 | -308 | -322 | -353 |
| 2018 | -304 | -266 | -473 | -235 | -344 | -265 | -312 | -372 | -476 | -435 | -323 | -471 |
| 2019 | -444 | -322 | -208 | -308 | -107 | 49 | 96 | 56 | -267 | -227 | 51 | 20 |
| 2020 | -61 | -244 | 80 | 51 | 220 | 115 | 252 | 268 | 253 | 99 | 149 | -6 |
| 2021 | 55 | 199 | 113 | 295 | 500 | 518 | 253 | 166 | -3 | 25 | 14 | -90 |
| 2022 | -74 | -69 | -57 | -27 | -4 | 39 | 65 | 202 | 15 | 118 | -34 | -35 |
| 2023 | 30 | -32 | -104 | -239 | -79 | -68 | -84 | -111 | -151 | -115 | -165 | -88 |
| 2024 | -96 | |||||||||||
| - = No Data Reported; -- = Not Applicable; NA = Not Available; W = Withheld to avoid disclosure of individual company data. |
| Release Date: 3/29/2024 |
| Next Release Date: 4/30/2024 |