|
Download Data (XLS File) |
|
||||||||
|
||||||||
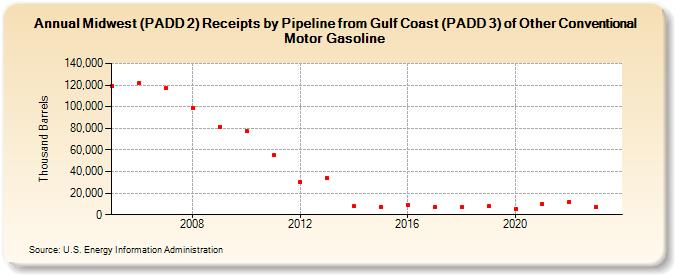
| Midwest (PADD 2) Receipts by Pipeline from Gulf Coast (PADD 3) of Other Conventional Motor Gasoline (Thousand Barrels) | ||||||||
| Decade | Year-0 | Year-1 | Year-2 | Year-3 | Year-4 | Year-5 | Year-6 | Year-7 | Year-8 | Year-9 |
|---|---|---|---|---|---|---|---|---|---|---|
| 2000's | 119,273 | 122,177 | 117,333 | 99,167 | 81,621 | |||||
| 2010's | 77,108 | 55,250 | 30,271 | 33,776 | 7,728 | 7,505 | 9,418 | 7,575 | 7,044 | 7,752 |
| 2020's | 5,472 | 10,189 | 12,052 | 7,029 |
| - = No Data Reported; -- = Not Applicable; NA = Not Available; W = Withheld to avoid disclosure of individual company data. |
| Release Date: 8/30/2024 |
| Next Release Date: 8/29/2025 |