|
Download Data (XLS File) |
|
||||||||
|
||||||||
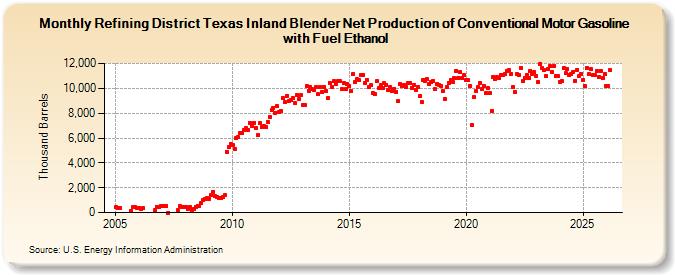
| Refining District Texas Inland Blender Net Production of Conventional Motor Gasoline with Fuel Ethanol (Thousand Barrels) | ||||||||
| Year | Jan | Feb | Mar | Apr | May | Jun | Jul | Aug | Sep | Oct | Nov | Dec |
|---|---|---|---|---|---|---|---|---|---|---|---|---|
| 2005 | 411 | 341 | 406 | 158 | 456 | 424 | 354 | |||||
| 2006 | 368 | 298 | 353 | 184 | 480 | 483 | 514 | |||||
| 2007 | 562 | 530 | 521 | 3 | 195 | 491 | 463 | 449 | ||||
| 2008 | 458 | 317 | 451 | 226 | 326 | 468 | 549 | 565 | 748 | 1,000 | 1,111 | 1,156 |
| 2009 | 1,109 | 1,432 | 1,672 | 1,343 | 1,234 | 1,160 | 1,208 | 1,219 | 1,384 | 4,898 | 5,252 | 5,526 |
| 2010 | 5,418 | 5,122 | 5,980 | 6,047 | 6,413 | 6,439 | 6,671 | 6,796 | 6,673 | 7,246 | 7,001 | 7,234 |
| 2011 | 6,842 | 6,233 | 7,172 | 6,907 | 6,962 | 6,864 | 7,323 | 7,730 | 8,221 | 8,439 | 8,048 | 8,544 |
| 2012 | 8,106 | 8,178 | 9,219 | 8,870 | 9,409 | 8,954 | 9,029 | 9,215 | 8,818 | 9,448 | 9,116 | 9,433 |
| 2013 | 8,625 | 8,656 | 10,174 | 9,818 | 10,113 | 9,924 | 9,891 | 10,088 | 9,509 | 10,121 | 9,727 | 10,145 |
| 2014 | 9,770 | 9,227 | 10,435 | 10,108 | 10,566 | 10,335 | 10,561 | 10,555 | 9,909 | 10,445 | 9,925 | 10,350 |
| 2015 | 10,172 | 9,783 | 11,144 | 10,499 | 10,734 | 10,658 | 11,103 | 11,080 | 10,448 | 10,681 | 10,121 | 10,239 |
| 2016 | 9,648 | 9,514 | 10,567 | 10,018 | 10,267 | 10,023 | 10,393 | 10,297 | 9,861 | 10,071 | 9,763 | 9,986 |
| 2017 | 9,738 | 8,952 | 10,366 | 10,159 | 10,303 | 10,099 | 10,409 | 10,415 | 10,056 | 10,305 | 9,874 | 10,087 |
| 2018 | 9,345 | 8,904 | 10,706 | 10,569 | 10,726 | 10,330 | 10,492 | 10,624 | 9,963 | 10,335 | 10,287 | 10,176 |
| 2019 | 9,775 | 9,163 | 10,086 | 10,455 | 10,694 | 10,549 | 10,797 | 11,430 | 10,853 | 11,304 | 10,837 | 11,050 |
| 2020 | 10,689 | 10,635 | 10,171 | 7,058 | 9,279 | 9,761 | 10,101 | 10,414 | 9,949 | 10,190 | 9,639 | 10,051 |
| 2021 | 9,643 | 8,157 | 10,943 | 10,752 | 10,886 | 10,811 | 11,070 | 11,108 | 11,184 | 11,404 | 11,474 | 11,139 |
| 2022 | 10,111 | 9,688 | 11,144 | 11,056 | 11,650 | 10,557 | 10,864 | 11,082 | 10,831 | 11,428 | 11,145 | 11,283 |
| 2023 | 11,088 | 10,509 | 11,990 | 11,600 | 11,512 | 11,093 | 11,537 | 11,780 | 11,352 | 11,816 | 10,987 | 10,865 |
| 2024 | 10,525 | |||||||||||
| - = No Data Reported; -- = Not Applicable; NA = Not Available; W = Withheld to avoid disclosure of individual company data. |
| Release Date: 3/29/2024 |
| Next Release Date: 4/30/2024 |