|
Download Data (XLS File) |
|
||||||||
|
||||||||
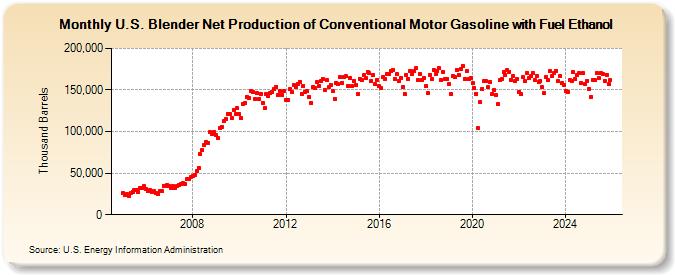
| U.S. Blender Net Production of Conventional Motor Gasoline with Fuel Ethanol (Thousand Barrels) | ||||||||
| Year | Jan | Feb | Mar | Apr | May | Jun | Jul | Aug | Sep | Oct | Nov | Dec |
|---|---|---|---|---|---|---|---|---|---|---|---|---|
| 2005 | 25,621 | 23,579 | 25,089 | 23,038 | 26,260 | 27,758 | 30,307 | 30,206 | 27,444 | 32,245 | 32,145 | 34,052 |
| 2006 | 31,105 | 28,156 | 29,170 | 27,295 | 28,272 | 26,237 | 24,476 | 28,126 | 28,076 | 34,954 | 34,559 | 35,876 |
| 2007 | 34,354 | 32,270 | 34,206 | 32,103 | 34,736 | 35,685 | 36,989 | 38,011 | 37,363 | 42,722 | 43,008 | 45,020 |
| 2008 | 46,923 | 48,140 | 52,310 | 56,607 | 72,840 | 77,546 | 83,672 | 87,960 | 86,293 | 99,250 | 97,581 | 98,867 |
| 2009 | 95,541 | 92,223 | 104,231 | 105,757 | 112,568 | 114,516 | 121,237 | 120,964 | 115,795 | 125,955 | 120,708 | 128,045 |
| 2010 | 121,097 | 115,958 | 133,135 | 133,886 | 142,044 | 140,429 | 148,770 | 147,303 | 139,250 | 145,864 | 139,015 | 145,715 |
| 2011 | 134,728 | 128,294 | 145,701 | 142,894 | 146,071 | 147,040 | 151,070 | 153,887 | 144,321 | 148,972 | 143,728 | 148,931 |
| 2012 | 138,232 | 138,339 | 150,755 | 147,340 | 156,377 | 153,755 | 157,331 | 159,960 | 145,737 | 155,090 | 147,944 | 148,271 |
| 2013 | 141,672 | 134,463 | 154,162 | 151,891 | 159,583 | 154,783 | 160,330 | 162,754 | 150,181 | 161,756 | 153,607 | 156,504 |
| 2014 | 148,308 | 139,514 | 158,695 | 156,990 | 165,129 | 158,968 | 166,018 | 166,446 | 155,301 | 164,074 | 154,731 | 161,334 |
| 2015 | 156,106 | 145,504 | 163,428 | 161,475 | 167,635 | 164,917 | 171,677 | 170,075 | 160,572 | 167,715 | 156,582 | 162,340 |
| 2016 | 154,625 | 151,921 | 165,859 | 163,080 | 169,688 | 168,721 | 173,064 | 174,217 | 163,270 | 168,632 | 161,373 | 164,956 |
| 2017 | 153,490 | 145,161 | 168,308 | 162,898 | 172,538 | 169,580 | 172,776 | 176,259 | 161,439 | 169,112 | 161,666 | 164,890 |
| 2018 | 154,390 | 146,089 | 168,590 | 162,710 | 174,275 | 169,152 | 172,753 | 175,936 | 161,443 | 171,595 | 163,534 | 163,306 |
| 2019 | 157,063 | 144,884 | 167,087 | 165,074 | 174,604 | 168,058 | 175,269 | 178,839 | 162,810 | 172,706 | 163,042 | 164,445 |
| 2020 | 158,007 | 152,549 | 145,701 | 103,873 | 135,106 | 151,540 | 161,011 | 160,272 | 153,003 | 159,457 | 145,442 | 149,439 |
| 2021 | 144,008 | 132,868 | 161,512 | 162,983 | 171,028 | 168,562 | 174,044 | 172,183 | 162,512 | 166,832 | 160,212 | 162,595 |
| 2022 | 148,073 | 144,770 | 165,043 | 160,711 | 170,433 | 163,862 | 166,362 | 170,874 | 161,745 | 166,532 | 159,472 | 160,471 |
| 2023 | 153,019 | 146,011 | 165,775 | 161,383 | 172,150 | 166,761 | 170,088 | 173,344 | 160,479 | 166,604 | 157,956 | 156,068 |
| 2024 | 148,639 | |||||||||||
| - = No Data Reported; -- = Not Applicable; NA = Not Available; W = Withheld to avoid disclosure of individual company data. |
| Release Date: 3/29/2024 |
| Next Release Date: 4/30/2024 |