|
Download Data (XLS File) |
|
||||||||
|
||||||||
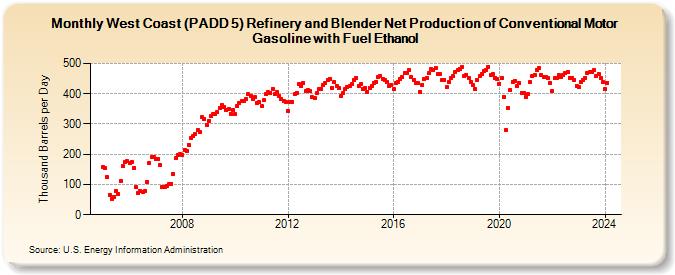
| West Coast (PADD 5) Refinery and Blender Net Production of Conventional Motor Gasoline with Fuel Ethanol (Thousand Barrels per Day) | ||||||||
| Year | Jan | Feb | Mar | Apr | May | Jun | Jul | Aug | Sep | Oct | Nov | Dec |
|---|---|---|---|---|---|---|---|---|---|---|---|---|
| 2005 | 157 | 153 | 124 | 65 | 53 | 60 | 77 | 69 | 110 | 160 | 175 | 176 |
| 2006 | 172 | 174 | 155 | 90 | 72 | 78 | 76 | 78 | 109 | 172 | 191 | 191 |
| 2007 | 183 | 185 | 164 | 91 | 91 | 96 | 100 | 103 | 134 | 187 | 199 | 200 |
| 2008 | 198 | 215 | 211 | 230 | 252 | 260 | 268 | 280 | 272 | 322 | 317 | 298 |
| 2009 | 310 | 325 | 332 | 333 | 338 | 353 | 362 | 356 | 345 | 348 | 334 | 346 |
| 2010 | 332 | 358 | 370 | 375 | 377 | 382 | 399 | 394 | 384 | 388 | 369 | 371 |
| 2011 | 359 | 378 | 398 | 405 | 404 | 417 | 398 | 405 | 393 | 383 | 376 | 374 |
| 2012 | 344 | 372 | 374 | 398 | 404 | 431 | 425 | 435 | 409 | 413 | 408 | 388 |
| 2013 | 385 | 402 | 415 | 417 | 428 | 437 | 444 | 450 | 419 | 439 | 426 | 420 |
| 2014 | 391 | 404 | 414 | 422 | 424 | 431 | 446 | 452 | 425 | 432 | 416 | 420 |
| 2015 | 407 | 419 | 426 | 437 | 440 | 456 | 459 | 448 | 444 | 439 | 427 | 430 |
| 2016 | 414 | 437 | 440 | 450 | 454 | 468 | 470 | 478 | 455 | 445 | 436 | 434 |
| 2017 | 406 | 429 | 450 | 452 | 467 | 481 | 478 | 486 | 466 | 464 | 445 | 445 |
| 2018 | 422 | 440 | 452 | 457 | 471 | 478 | 481 | 489 | 459 | 463 | 452 | 440 |
| 2019 | 428 | 415 | 447 | 457 | 465 | 474 | 480 | 490 | 462 | 465 | 453 | 449 |
| 2020 | 433 | 452 | 390 | 280 | 353 | 412 | 439 | 443 | 426 | 435 | 404 | 401 |
| 2021 | 389 | 398 | 438 | 457 | 463 | 479 | 484 | 462 | 455 | 455 | 451 | 436 |
| 2022 | 409 | 451 | 452 | 461 | 456 | 462 | 468 | 473 | 452 | 453 | 447 | 427 |
| 2023 | 422 | 439 | 447 | 453 | 469 | 471 | 473 | 477 | 457 | 466 | 452 | 438 |
| 2024 | 415 | |||||||||||
| - = No Data Reported; -- = Not Applicable; NA = Not Available; W = Withheld to avoid disclosure of individual company data. |
| Release Date: 3/29/2024 |
| Next Release Date: 4/30/2024 |