|
Download Data (XLS File) |
|
||||||||
|
||||||||
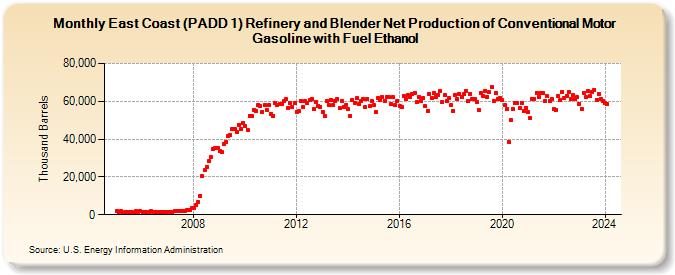
| East Coast (PADD 1) Refinery and Blender Net Production of Conventional Motor Gasoline with Fuel Ethanol (Thousand Barrels) | ||||||||
| Year | Jan | Feb | Mar | Apr | May | Jun | Jul | Aug | Sep | Oct | Nov | Dec |
|---|---|---|---|---|---|---|---|---|---|---|---|---|
| 2005 | 1,705 | 1,605 | 1,853 | 1,126 | 1,201 | 1,269 | 1,363 | 1,410 | 1,156 | 1,702 | 1,669 | 1,705 |
| 2006 | 1,372 | 1,379 | 1,530 | 1,598 | 1,784 | 1,637 | 1,680 | 1,563 | 1,348 | 1,443 | 1,405 | 1,439 |
| 2007 | 1,280 | 1,287 | 1,371 | 1,830 | 2,123 | 2,070 | 2,135 | 2,222 | 2,028 | 2,283 | 2,573 | 3,305 |
| 2008 | 3,748 | 5,150 | 6,913 | 10,063 | 20,389 | 23,458 | 25,494 | 28,431 | 30,379 | 34,567 | 35,320 | 35,531 |
| 2009 | 33,949 | 33,156 | 37,476 | 38,589 | 41,412 | 42,244 | 45,402 | 45,579 | 43,707 | 47,639 | 45,175 | 48,529 |
| 2010 | 46,781 | 44,960 | 52,354 | 52,412 | 55,632 | 54,638 | 58,215 | 57,589 | 54,469 | 57,915 | 55,311 | 57,997 |
| 2011 | 53,477 | 52,444 | 59,045 | 58,104 | 58,690 | 58,306 | 59,940 | 60,952 | 56,549 | 58,977 | 56,979 | 59,035 |
| 2012 | 54,482 | 54,644 | 60,349 | 57,125 | 60,020 | 58,864 | 60,424 | 61,474 | 55,746 | 59,765 | 57,648 | 57,118 |
| 2013 | 54,485 | 52,189 | 60,080 | 58,290 | 60,631 | 57,791 | 59,891 | 61,275 | 56,370 | 60,323 | 56,956 | 58,210 |
| 2014 | 55,869 | 52,267 | 60,464 | 59,049 | 61,587 | 58,433 | 60,223 | 61,147 | 56,752 | 61,432 | 57,317 | 60,021 |
| 2015 | 58,002 | 54,435 | 61,735 | 60,546 | 62,294 | 60,318 | 62,400 | 62,521 | 58,492 | 62,094 | 57,979 | 60,357 |
| 2016 | 57,610 | 56,929 | 62,976 | 61,011 | 63,091 | 62,166 | 63,845 | 64,641 | 59,501 | 62,427 | 60,098 | 61,565 |
| 2017 | 57,448 | 54,939 | 63,808 | 61,692 | 64,409 | 62,391 | 63,584 | 65,433 | 59,532 | 63,342 | 60,374 | 61,722 |
| 2018 | 57,795 | 55,041 | 63,496 | 60,998 | 64,111 | 62,512 | 63,593 | 65,608 | 60,035 | 64,098 | 61,349 | 61,144 |
| 2019 | 59,751 | 55,408 | 64,513 | 62,713 | 65,704 | 62,255 | 64,986 | 67,455 | 60,250 | 64,505 | 61,353 | 61,850 |
| 2020 | 60,428 | 57,841 | 55,859 | 38,265 | 50,109 | 56,024 | 59,225 | 59,103 | 56,395 | 59,295 | 54,908 | 56,336 |
| 2021 | 54,275 | 51,078 | 61,412 | 61,302 | 64,415 | 62,301 | 64,552 | 64,200 | 60,348 | 62,735 | 60,235 | 61,194 |
| 2022 | 55,984 | 55,641 | 62,855 | 60,759 | 64,659 | 61,887 | 62,693 | 64,857 | 61,316 | 63,435 | 61,055 | 62,088 |
| 2023 | 58,827 | 56,106 | 64,545 | 62,099 | 65,541 | 62,738 | 64,794 | 66,199 | 60,922 | 64,072 | 61,261 | 60,101 |
| 2024 | 59,088 | |||||||||||
| - = No Data Reported; -- = Not Applicable; NA = Not Available; W = Withheld to avoid disclosure of individual company data. |
| Release Date: 3/29/2024 |
| Next Release Date: 4/30/2024 |