|
Download Data (XLS File) |
|
||||||||
|
||||||||
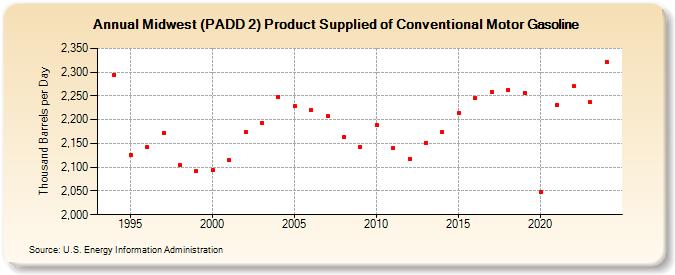
| Midwest (PADD 2) Product Supplied of Conventional Motor Gasoline (Thousand Barrels per Day) | ||||||||
| Decade | Year-0 | Year-1 | Year-2 | Year-3 | Year-4 | Year-5 | Year-6 | Year-7 | Year-8 | Year-9 |
|---|---|---|---|---|---|---|---|---|---|---|
| 1990's | NA | 2,295 | 2,126 | 2,142 | 2,173 | 2,105 | 2,091 | |||
| 2000's | 2,094 | 2,115 | 2,174 | 2,194 | 2,248 | 2,228 | 2,221 | 2,207 | 2,163 | 2,143 |
| 2010's | 2,189 | 2,140 | 2,118 | 2,151 | 2,174 | 2,214 | 2,246 | 2,259 | 2,262 | 2,257 |
| 2020's | 2,048 | 2,231 | 2,270 | 2,240 |
| - = No Data Reported; -- = Not Applicable; NA = Not Available; W = Withheld to avoid disclosure of individual company data. |
| Release Date: 3/29/2024 |
| Next Release Date: 8/30/2024 |