|
Download Data (XLS File) |
|
||||||||
|
||||||||
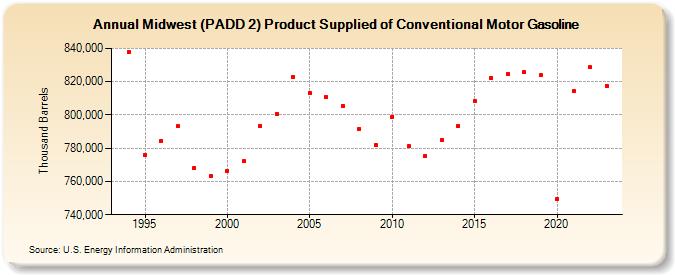
| Midwest (PADD 2) Product Supplied of Conventional Motor Gasoline (Thousand Barrels) | ||||||||
| Decade | Year-0 | Year-1 | Year-2 | Year-3 | Year-4 | Year-5 | Year-6 | Year-7 | Year-8 | Year-9 |
|---|---|---|---|---|---|---|---|---|---|---|
| 1990's | NA | 837,821 | 776,020 | 784,203 | 793,160 | 768,123 | 763,102 | |||
| 2000's | 766,362 | 772,037 | 793,496 | 800,695 | 822,808 | 813,356 | 810,826 | 805,382 | 791,543 | 782,039 |
| 2010's | 798,954 | 781,162 | 775,088 | 785,096 | 793,431 | 808,167 | 822,085 | 824,589 | 825,554 | 823,836 |
| 2020's | 749,525 | 814,457 | 828,594 | 817,709 |
| - = No Data Reported; -- = Not Applicable; NA = Not Available; W = Withheld to avoid disclosure of individual company data. |
| Release Date: 3/29/2024 |
| Next Release Date: 8/30/2024 |