|
Download Data (XLS File) |
|
||||||||
|
||||||||
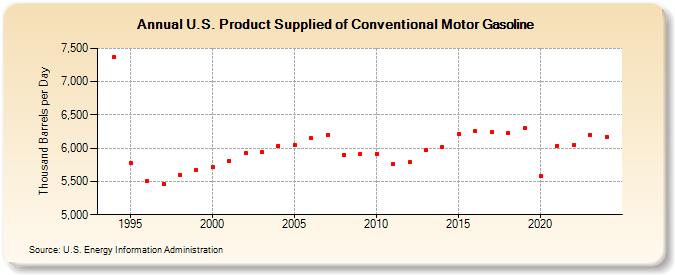
| U.S. Product Supplied of Conventional Motor Gasoline (Thousand Barrels per Day) | ||||||||
| Decade | Year-0 | Year-1 | Year-2 | Year-3 | Year-4 | Year-5 | Year-6 | Year-7 | Year-8 | Year-9 |
|---|---|---|---|---|---|---|---|---|---|---|
| 1990's | NA | 7,364 | 5,775 | 5,501 | 5,464 | 5,598 | 5,669 | |||
| 2000's | 5,711 | 5,809 | 5,922 | 5,940 | 6,037 | 6,055 | 6,150 | 6,193 | 5,894 | 5,916 |
| 2010's | 5,917 | 5,758 | 5,788 | 5,968 | 6,011 | 6,219 | 6,251 | 6,237 | 6,227 | 6,296 |
| 2020's | 5,582 | 6,037 | 6,049 | 6,203 |
| - = No Data Reported; -- = Not Applicable; NA = Not Available; W = Withheld to avoid disclosure of individual company data. |
| Release Date: 3/29/2024 |
| Next Release Date: 8/30/2024 |