|
Download Data (XLS File) |
|
||||||||
|
||||||||
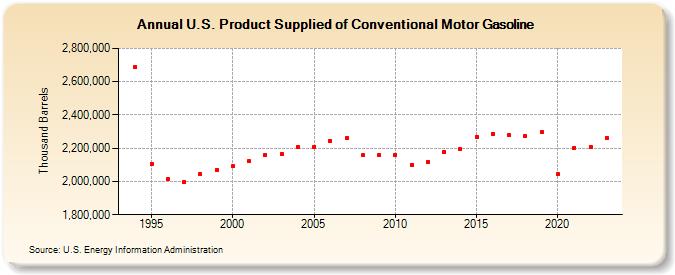
| U.S. Product Supplied of Conventional Motor Gasoline (Thousand Barrels) | ||||||||
| Decade | Year-0 | Year-1 | Year-2 | Year-3 | Year-4 | Year-5 | Year-6 | Year-7 | Year-8 | Year-9 |
|---|---|---|---|---|---|---|---|---|---|---|
| 1990's | NA | 2,688,014 | 2,107,537 | 2,013,322 | 1,994,487 | 2,043,202 | 2,069,142 | |||
| 2000's | 2,089,914 | 2,120,479 | 2,161,589 | 2,167,991 | 2,209,437 | 2,210,128 | 2,244,656 | 2,260,543 | 2,157,083 | 2,159,394 |
| 2010's | 2,159,637 | 2,101,531 | 2,118,580 | 2,178,209 | 2,194,118 | 2,269,949 | 2,287,977 | 2,276,417 | 2,272,890 | 2,297,971 |
| 2020's | 2,043,159 | 2,203,443 | 2,207,837 | 2,264,210 |
| - = No Data Reported; -- = Not Applicable; NA = Not Available; W = Withheld to avoid disclosure of individual company data. |
| Release Date: 3/29/2024 |
| Next Release Date: 8/30/2024 |