|
Download Data (XLS File) |
|
||||||||
|
||||||||
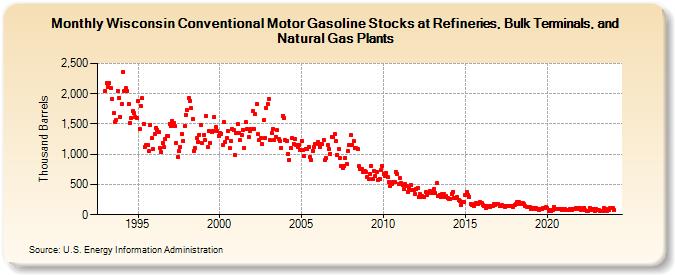
| Wisconsin Conventional Motor Gasoline Stocks at Refineries, Bulk Terminals, and Natural Gas Plants (Thousand Barrels) | ||||||||
| Year | Jan | Feb | Mar | Apr | May | Jun | Jul | Aug | Sep | Oct | Nov | Dec |
|---|---|---|---|---|---|---|---|---|---|---|---|---|
| 1993 | 2,041 | 2,174 | 2,118 | 2,173 | 2,092 | 1,913 | 1,680 | 1,539 | 1,559 | 2,051 | 1,937 | 1,623 |
| 1994 | 1,830 | 2,365 | 2,053 | 2,088 | 2,043 | 1,829 | 1,519 | 1,599 | 1,707 | 1,677 | 1,620 | 1,597 |
| 1995 | 1,876 | 1,421 | 1,800 | 1,923 | 1,507 | 1,123 | 1,146 | 1,156 | 1,049 | 1,485 | 1,260 | 1,088 |
| 1996 | 1,335 | 1,439 | 1,400 | 1,366 | 1,101 | 1,029 | 1,183 | 1,115 | 1,245 | 1,295 | 1,305 | 1,504 |
| 1997 | 1,461 | 1,554 | 1,520 | 1,466 | 1,186 | 960 | 1,051 | 1,115 | 1,338 | 1,223 | 1,464 | 1,655 |
| 1998 | 1,725 | 1,927 | 1,888 | 1,758 | 1,584 | 1,048 | 1,105 | 1,267 | 1,207 | 1,326 | 1,489 | 1,189 |
| 1999 | 1,318 | 1,239 | 1,638 | 1,112 | 1,392 | 1,190 | 1,373 | 1,391 | 1,612 | 1,448 | 1,392 | 1,303 |
| 2000 | 1,348 | 1,341 | 1,154 | 1,529 | 1,204 | 1,268 | 1,377 | 1,102 | 1,225 | 1,417 | 1,394 | 991 |
| 2001 | 1,358 | 1,497 | 1,343 | 1,229 | 1,313 | 1,400 | 1,107 | 1,525 | 1,425 | 1,288 | 1,389 | 1,421 |
| 2002 | 1,711 | 1,425 | 1,660 | 1,834 | 1,327 | 1,234 | 1,274 | 1,163 | 1,559 | 1,269 | 1,767 | 1,830 |
| 2003 | 1,914 | 1,227 | 1,348 | 1,421 | 1,232 | 1,285 | 1,395 | 1,253 | 1,213 | 1,106 | 1,637 | 1,606 |
| 2004 | 1,230 | 1,216 | 1,010 | 912 | 1,099 | 1,268 | 1,169 | 1,258 | 1,158 | 1,116 | 1,148 | 1,071 |
| 2005 | 1,225 | 1,072 | 971 | 1,083 | 1,093 | 1,124 | 956 | 906 | 1,056 | 1,119 | 1,173 | 1,177 |
| 2006 | 1,204 | 1,120 | 1,163 | 1,163 | 1,241 | 897 | 934 | 1,150 | 1,094 | 1,010 | 1,289 | 1,277 |
| 2007 | 1,331 | 1,213 | 985 | 1,090 | 941 | 810 | 768 | 803 | 936 | 841 | 1,057 | 1,151 |
| 2008 | 1,318 | 1,154 | 1,212 | 1,106 | 1,095 | 1,092 | 800 | 759 | 762 | 708 | 723 | 704 |
| 2009 | 621 | 587 | 676 | 807 | 592 | 723 | 641 | 707 | 582 | 596 | 732 | 807 |
| 2010 | 679 | 633 | 696 | 626 | 545 | 478 | 507 | 534 | 545 | 706 | 681 | 501 |
| 2011 | 606 | 530 | 488 | 424 | 504 | 477 | 382 | 433 | 494 | 408 | 411 | 343 |
| 2012 | 433 | 438 | 293 | 335 | 312 | 285 | 299 | 370 | 331 | 354 | 387 | 376 |
| 2013 | 356 | 426 | 358 | 517 | 312 | 327 | 298 | 339 | 338 | 297 | 311 | 272 |
| 2014 | 268 | 260 | 344 | 380 | 281 | 280 | 292 | 237 | 229 | 168 | 208 | 214 |
| 2015 | 329 | 375 | 334 | 290 | 179 | 159 | 148 | 184 | 186 | 178 | 194 | 205 |
| 2016 | 200 | 161 | 146 | 112 | 137 | 142 | 127 | 146 | 138 | 181 | 158 | 171 |
| 2017 | 185 | 143 | 143 | 156 | 148 | 133 | 138 | 149 | 146 | 141 | 140 | 133 |
| 2018 | 167 | 177 | 206 | 207 | 169 | 181 | 196 | 171 | 136 | 131 | 123 | 130 |
| 2019 | 98 | 106 | 111 | 102 | 107 | 93 | 71 | 101 | 89 | 109 | 108 | 121 |
| 2020 | 104 | 59 | 70 | 57 | 80 | 128 | 87 | 101 | 95 | 97 | 101 | 70 |
| 2021 | 89 | 90 | 72 | 71 | 73 | 91 | 72 | 94 | 91 | 107 | 111 | 92 |
| 2022 | 104 | 80 | 93 | 118 | 71 | 54 | 61 | 113 | 86 | 91 | 98 | 58 |
| 2023 | 95 | 74 | 70 | 59 | 64 | 67 | 110 | 89 | 66 | 81 | 108 | 109 |
| 2024 | 119 | |||||||||||
| - = No Data Reported; -- = Not Applicable; NA = Not Available; W = Withheld to avoid disclosure of individual company data. |
| Release Date: 3/29/2024 |
| Next Release Date: 4/30/2024 |