|
Download Data (XLS File) |
|
||||||||
|
||||||||
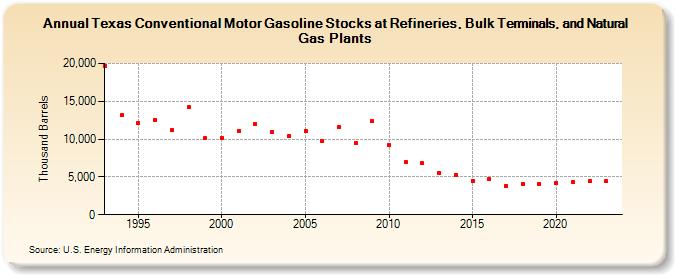
| Texas Conventional Motor Gasoline Stocks at Refineries, Bulk Terminals, and Natural Gas Plants (Thousand Barrels) | ||||||||
| Decade | Year-0 | Year-1 | Year-2 | Year-3 | Year-4 | Year-5 | Year-6 | Year-7 | Year-8 | Year-9 |
|---|---|---|---|---|---|---|---|---|---|---|
| 1990's | 19,722 | 13,129 | 12,176 | 12,589 | 11,169 | 14,214 | 10,107 | |||
| 2000's | 10,119 | 11,052 | 11,971 | 10,957 | 10,367 | 11,097 | 9,806 | 11,559 | 9,530 | 12,402 |
| 2010's | 9,218 | 6,945 | 6,804 | 5,462 | 5,244 | 4,519 | 4,737 | 3,855 | 4,092 | 4,069 |
| 2020's | 4,223 | 4,284 | 4,417 | 4,414 |
| - = No Data Reported; -- = Not Applicable; NA = Not Available; W = Withheld to avoid disclosure of individual company data. |
| Release Date: 3/29/2024 |
| Next Release Date: 8/30/2024 |