|
Download Data (XLS File) |
|
||||||||
|
||||||||
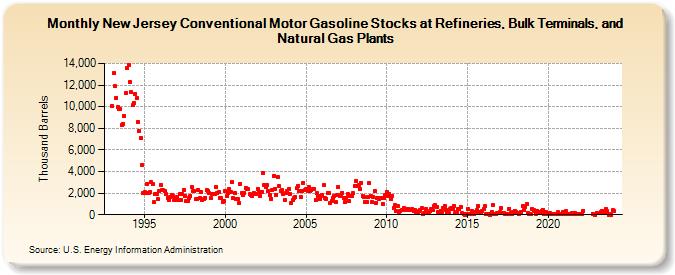
| New Jersey Conventional Motor Gasoline Stocks at Refineries, Bulk Terminals, and Natural Gas Plants (Thousand Barrels) | ||||||||
| Year | Jan | Feb | Mar | Apr | May | Jun | Jul | Aug | Sep | Oct | Nov | Dec |
|---|---|---|---|---|---|---|---|---|---|---|---|---|
| 1993 | 10,058 | 13,100 | 11,873 | 10,837 | 9,940 | 9,789 | 9,765 | 8,332 | 8,425 | 9,161 | 11,256 | 13,603 |
| 1994 | 13,901 | 12,300 | 11,324 | 10,154 | 10,375 | 11,177 | 10,824 | 8,606 | 7,770 | 7,126 | 4,603 | 1,984 |
| 1995 | 2,090 | 1,989 | 2,889 | 1,973 | 2,124 | 3,003 | 2,823 | 1,138 | 1,894 | 1,902 | 1,414 | 2,169 |
| 1996 | 2,781 | 2,273 | 2,257 | 2,175 | 1,884 | 1,544 | 1,367 | 1,640 | 1,832 | 1,734 | 1,328 | 1,488 |
| 1997 | 1,636 | 1,391 | 1,922 | 1,375 | 1,915 | 2,292 | 1,763 | 1,306 | 1,294 | 1,583 | 1,778 | 2,545 |
| 1998 | 2,177 | 2,171 | 1,424 | 1,450 | 2,271 | 1,510 | 2,074 | 1,407 | 1,438 | 1,587 | 2,243 | 2,208 |
| 1999 | 1,984 | 1,507 | 1,929 | 1,892 | 1,882 | 2,594 | 1,996 | 2,095 | 1,576 | 1,523 | 1,222 | 1,292 |
| 2000 | 2,175 | 1,709 | 2,054 | 2,348 | 2,057 | 2,990 | 1,552 | 1,994 | 1,437 | 1,454 | 1,083 | 2,845 |
| 2001 | 1,987 | 1,823 | 2,030 | 2,506 | 2,386 | 2,335 | 1,876 | 1,867 | 1,714 | 2,014 | 1,950 | 1,906 |
| 2002 | 2,381 | 2,123 | 1,722 | 2,146 | 3,830 | 2,707 | 2,547 | 2,715 | 2,166 | 1,842 | 1,485 | 2,330 |
| 2003 | 3,594 | 2,420 | 1,806 | 3,501 | 2,612 | 2,215 | 2,243 | 1,925 | 1,350 | 1,996 | 2,212 | 2,362 |
| 2004 | 1,874 | 1,077 | 1,328 | 1,504 | 1,598 | 2,462 | 2,704 | 2,201 | 1,645 | 2,201 | 2,959 | 2,276 |
| 2005 | 2,344 | 2,195 | 2,558 | 2,201 | 2,280 | 2,386 | 2,419 | 1,401 | 1,982 | 1,745 | 1,428 | 1,756 |
| 2006 | 1,788 | 2,728 | 1,569 | 1,493 | 2,048 | 2,024 | 1,082 | 1,263 | 1,527 | 1,714 | 1,217 | 1,795 |
| 2007 | 2,543 | 1,700 | 1,852 | 2,050 | 1,580 | 1,168 | 1,563 | 1,908 | 1,240 | 1,751 | 1,753 | 1,982 |
| 2008 | 2,688 | 3,112 | 2,664 | 2,717 | 2,363 | 2,967 | 1,744 | 1,640 | 1,197 | 1,198 | 1,614 | 2,956 |
| 2009 | 1,761 | 1,188 | 1,625 | 2,181 | 1,086 | 1,538 | 1,463 | 1,544 | 1,574 | 992 | 1,507 | 1,840 |
| 2010 | 2,092 | 1,772 | 1,960 | 1,493 | 1,719 | 608 | 861 | 325 | 779 | 257 | 351 | 444 |
| 2011 | 419 | 589 | 557 | 407 | 536 | 415 | 437 | 542 | 377 | 457 | 166 | 131 |
| 2012 | 340 | 426 | 579 | 56 | 198 | 545 | 279 | 270 | 300 | 491 | 391 | 795 |
| 2013 | 877 | 742 | 279 | 206 | 344 | 270 | 604 | 785 | 463 | 175 | 157 | 489 |
| 2014 | 582 | 496 | 833 | 162 | 283 | 516 | 508 | 745 | 114 | 22 | 10 | 102 |
| 2015 | 542 | 94 | 66 | 364 | 273 | 37 | 220 | 435 | 785 | 225 | 168 | 384 |
| 2016 | 534 | 804 | 23 | 60 | 98 | 16 | 236 | 921 | 109 | 53 | 116 | 178 |
| 2017 | 223 | 593 | 162 | 184 | 22 | 22 | 22 | 560 | 120 | 32 | 233 | 376 |
| 2018 | 252 | 179 | 60 | 114 | 260 | 814 | 397 | 749 | 1,033 | 181 | 40 | 40 |
| 2019 | 508 | 417 | 304 | 97 | 381 | 116 | 222 | 326 | 463 | 70 | 286 | 31 |
| 2020 | 168 | 181 | 55 | 31 | 106 | 31 | 38 | 221 | 46 | 38 | 31 | 230 |
| 2021 | 32 | 306 | 33 | 33 | 33 | 41 | 121 | 35 | 173 | 109 | 90 | 35 |
| 2022 | 42 | 95 | 381 | 92 | 3 | |||||||
| 2023 | 159 | 236 | 379 | 186 | 152 | 538 | 300 | 15 | 47 | 15 | ||
| 2024 | 393 | |||||||||||
| - = No Data Reported; -- = Not Applicable; NA = Not Available; W = Withheld to avoid disclosure of individual company data. |
| Release Date: 3/29/2024 |
| Next Release Date: 4/30/2024 |