|
Download Data (XLS File) |
|
||||||||
|
||||||||
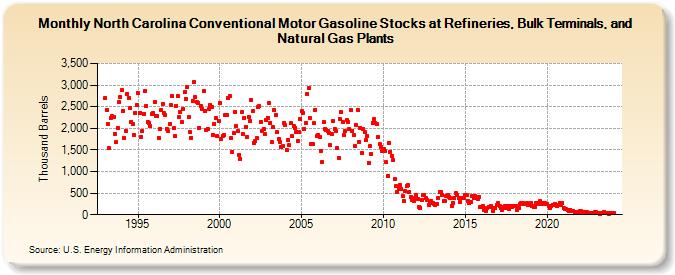
| North Carolina Conventional Motor Gasoline Stocks at Refineries, Bulk Terminals, and Natural Gas Plants (Thousand Barrels) | ||||||||
| Year | Jan | Feb | Mar | Apr | May | Jun | Jul | Aug | Sep | Oct | Nov | Dec |
|---|---|---|---|---|---|---|---|---|---|---|---|---|
| 1993 | 2,701 | 2,428 | 2,092 | 1,534 | 2,248 | 2,280 | 2,260 | 1,875 | 1,673 | 2,017 | 2,600 | 2,725 |
| 1994 | 2,881 | 2,410 | 1,774 | 1,939 | 2,805 | 2,709 | 2,473 | 2,156 | 2,109 | 1,841 | 2,365 | 2,544 |
| 1995 | 2,810 | 2,361 | 1,805 | 1,933 | 2,337 | 2,870 | 2,515 | 2,157 | 2,112 | 2,049 | 2,331 | 2,357 |
| 1996 | 2,601 | 2,277 | 2,273 | 1,774 | 1,991 | 2,434 | 2,564 | 2,347 | 2,306 | 1,984 | 1,935 | 2,102 |
| 1997 | 2,542 | 2,744 | 1,999 | 1,811 | 2,515 | 2,755 | 2,270 | 2,377 | 2,141 | 2,443 | 2,839 | 2,687 |
| 1998 | 2,954 | 2,252 | 1,919 | 1,783 | 2,632 | 3,081 | 2,718 | 2,608 | 2,589 | 2,017 | 2,512 | 2,448 |
| 1999 | 2,865 | 2,407 | 1,967 | 1,985 | 2,452 | 2,540 | 2,490 | 1,843 | 2,103 | 2,237 | 1,822 | 2,163 |
| 2000 | 2,588 | 1,761 | 1,822 | 1,847 | 2,298 | 2,312 | 2,708 | 2,744 | 1,766 | 1,459 | 1,896 | 2,384 |
| 2001 | 2,042 | 1,929 | 1,393 | 1,286 | 2,372 | 1,869 | 2,248 | 2,041 | 1,807 | 2,260 | 2,159 | 2,658 |
| 2002 | 2,399 | 1,656 | 1,705 | 1,770 | 2,492 | 2,511 | 2,152 | 1,936 | 1,983 | 1,857 | 2,194 | 2,245 |
| 2003 | 2,574 | 2,130 | 1,677 | 2,021 | 2,422 | 2,313 | 1,906 | 1,758 | 1,684 | 1,565 | 1,580 | 2,129 |
| 2004 | 2,073 | 1,499 | 1,727 | 1,612 | 2,114 | 1,814 | 2,048 | 2,011 | 1,915 | 1,708 | 1,910 | 2,221 |
| 2005 | 2,389 | 2,353 | 1,992 | 2,131 | 2,804 | 2,937 | 2,242 | 1,632 | 1,638 | 2,112 | 2,434 | 1,821 |
| 2006 | 1,852 | 1,807 | 1,477 | 1,224 | 2,145 | 1,986 | 1,970 | 1,933 | 1,898 | 1,603 | 1,862 | 2,158 |
| 2007 | 1,985 | 1,935 | 1,547 | 1,312 | 2,204 | 2,369 | 2,135 | 1,834 | 1,929 | 2,181 | 2,148 | 1,977 |
| 2008 | 2,425 | 1,945 | 1,841 | 1,581 | 2,067 | 2,434 | 1,685 | 2,016 | 1,438 | 1,992 | 1,924 | 1,724 |
| 2009 | 1,816 | 1,206 | 1,589 | 1,410 | 2,124 | 2,207 | 2,116 | 2,106 | 1,802 | 1,625 | 1,569 | 1,470 |
| 2010 | 1,512 | 1,466 | 1,209 | 901 | 1,658 | 1,459 | 1,370 | 1,272 | 820 | 659 | 537 | 591 |
| 2011 | 690 | 598 | 429 | 321 | 542 | 662 | 688 | 533 | 412 | 329 | 323 | 389 |
| 2012 | 453 | 370 | 187 | 164 | 344 | 465 | 450 | 378 | 334 | 228 | 263 | 317 |
| 2013 | 279 | 258 | 225 | 251 | 387 | 522 | 535 | 457 | 320 | 318 | 427 | 466 |
| 2014 | 412 | 376 | 207 | 273 | 395 | 501 | 445 | 391 | 290 | 391 | 393 | 395 |
| 2015 | 450 | 466 | 322 | 270 | 298 | 437 | 398 | 432 | 380 | 369 | 417 | 167 |
| 2016 | 170 | 191 | 101 | 97 | 152 | 188 | 188 | 197 | 97 | 154 | 165 | 232 |
| 2017 | 265 | 210 | 145 | 118 | 188 | 195 | 149 | 196 | 141 | 197 | 175 | 200 |
| 2018 | 194 | 207 | 112 | 156 | 240 | 277 | 265 | 259 | 251 | 270 | 217 | 246 |
| 2019 | 274 | 210 | 181 | 188 | 267 | 253 | 264 | 311 | 246 | 262 | 261 | 239 |
| 2020 | 245 | 211 | 164 | 209 | 232 | 223 | 258 | 206 | 214 | 278 | 226 | 282 |
| 2021 | 162 | 141 | 126 | 106 | 89 | 113 | 95 | 83 | 65 | 67 | 74 | 74 |
| 2022 | 82 | 75 | 49 | 57 | 60 | 68 | 47 | 45 | 45 | 38 | 43 | 58 |
| 2023 | 56 | 51 | 45 | 18 | 36 | 49 | 53 | 45 | 34 | 27 | 51 | 49 |
| 2024 | 51 | |||||||||||
| - = No Data Reported; -- = Not Applicable; NA = Not Available; W = Withheld to avoid disclosure of individual company data. |
| Release Date: 3/29/2024 |
| Next Release Date: 4/30/2024 |