|
Download Data (XLS File) |
|
||||||||
|
||||||||
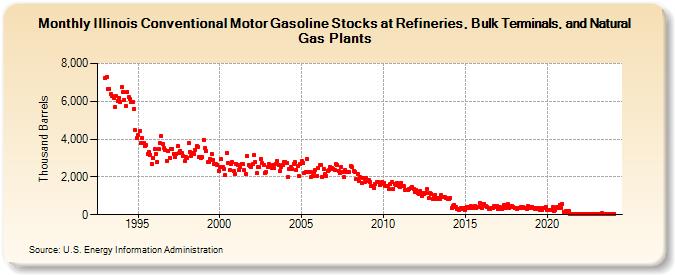
| Illinois Conventional Motor Gasoline Stocks at Refineries, Bulk Terminals, and Natural Gas Plants (Thousand Barrels) | ||||||||
| Year | Jan | Feb | Mar | Apr | May | Jun | Jul | Aug | Sep | Oct | Nov | Dec |
|---|---|---|---|---|---|---|---|---|---|---|---|---|
| 1993 | 7,222 | 7,311 | 6,647 | 6,676 | 6,377 | 6,282 | 6,189 | 5,713 | 6,254 | 6,029 | 6,193 | 5,943 |
| 1994 | 6,743 | 6,501 | 6,070 | 5,748 | 6,515 | 6,211 | 6,145 | 5,965 | 5,959 | 5,602 | 4,460 | 4,040 |
| 1995 | 4,229 | 4,416 | 3,771 | 4,066 | 3,771 | 3,642 | 3,679 | 3,212 | 3,294 | 3,182 | 2,671 | 2,995 |
| 1996 | 3,454 | 3,231 | 2,804 | 3,472 | 3,788 | 4,140 | 3,744 | 3,519 | 3,425 | 2,859 | 3,379 | 3,015 |
| 1997 | 3,499 | 3,492 | 3,228 | 3,054 | 3,199 | 3,633 | 3,250 | 3,387 | 3,248 | 3,081 | 2,821 | 3,037 |
| 1998 | 2,999 | 3,783 | 3,336 | 3,128 | 3,247 | 3,194 | 3,424 | 3,625 | 3,599 | 3,068 | 3,014 | 3,030 |
| 1999 | 3,974 | 3,511 | 3,357 | 2,768 | 2,769 | 2,954 | 3,235 | 2,920 | 2,679 | 2,666 | 2,645 | 2,317 |
| 2000 | 2,502 | 2,933 | 2,520 | 2,414 | 2,109 | 3,285 | 2,712 | 2,354 | 2,666 | 2,779 | 2,292 | 2,164 |
| 2001 | 2,697 | 2,612 | 2,372 | 2,518 | 2,686 | 2,658 | 2,357 | 2,147 | 3,095 | 2,615 | 2,577 | 2,546 |
| 2002 | 2,683 | 3,169 | 2,801 | 2,182 | 2,520 | 2,515 | 2,973 | 2,735 | 2,639 | 2,216 | 2,265 | 2,500 |
| 2003 | 2,663 | 2,501 | 2,492 | 2,627 | 2,451 | 2,696 | 2,844 | 2,620 | 2,314 | 2,521 | 2,650 | 2,777 |
| 2004 | 2,790 | 2,759 | 2,000 | 2,433 | 2,518 | 2,436 | 2,680 | 2,763 | 2,367 | 2,600 | 2,031 | 2,674 |
| 2005 | 2,845 | 2,761 | 2,200 | 2,271 | 2,953 | 2,283 | 2,277 | 1,997 | 2,059 | 2,236 | 2,341 | 2,071 |
| 2006 | 2,452 | 2,608 | 2,633 | 2,020 | 2,428 | 2,136 | 2,059 | 2,336 | 2,363 | 2,532 | 2,490 | 2,407 |
| 2007 | 2,374 | 2,679 | 2,609 | 2,325 | 2,197 | 2,542 | 2,278 | 1,971 | 2,351 | 2,271 | 2,255 | 2,251 |
| 2008 | 2,575 | 2,524 | 2,332 | 2,262 | 1,865 | 2,172 | 1,785 | 1,994 | 1,680 | 1,949 | 1,732 | 1,940 |
| 2009 | 1,786 | 1,819 | 1,739 | 1,506 | 1,522 | 1,437 | 1,605 | 1,733 | 1,748 | 1,556 | 1,603 | 1,739 |
| 2010 | 1,704 | 1,540 | 1,528 | 1,528 | 1,347 | 1,608 | 1,711 | 1,381 | 1,641 | 1,556 | 1,680 | 1,525 |
| 2011 | 1,471 | 1,682 | 1,529 | 1,499 | 1,298 | 1,316 | 1,305 | 1,337 | 1,391 | 1,464 | 1,374 | 1,214 |
| 2012 | 1,287 | 1,137 | 1,100 | 1,240 | 1,016 | 1,167 | 1,113 | 1,141 | 1,340 | 862 | 1,132 | 1,110 |
| 2013 | 836 | 924 | 1,045 | 847 | 896 | 827 | 1,027 | 924 | 949 | 940 | 882 | 826 |
| 2014 | 827 | 885 | 355 | 485 | 525 | 392 | 319 | 272 | 323 | 360 | 321 | 356 |
| 2015 | 260 | 431 | 383 | 340 | 437 | 359 | 374 | 450 | 347 | 414 | 428 | 605 |
| 2016 | 360 | 543 | 543 | 451 | 428 | 325 | 282 | 376 | 355 | 451 | 418 | 475 |
| 2017 | 314 | 420 | 349 | 326 | 499 | 339 | 515 | 557 | 349 | 457 | 445 | 410 |
| 2018 | 351 | 348 | 324 | 364 | 345 | 397 | 419 | 345 | 341 | 319 | 442 | 330 |
| 2019 | 394 | 433 | 366 | 288 | 344 | 307 | 354 | 247 | 234 | 368 | 334 | 425 |
| 2020 | 271 | 239 | 271 | 245 | 401 | 184 | 264 | 401 | 346 | 531 | 378 | 555 |
| 2021 | 149 | 145 | 188 | 167 | 178 | 44 | 49 | 36 | 34 | 37 | 37 | 30 |
| 2022 | 40 | 44 | 35 | 60 | 42 | 33 | 40 | 48 | 61 | 47 | 38 | 34 |
| 2023 | 44 | 29 | 23 | 19 | 70 | 55 | 39 | 55 | 38 | 44 | 52 | 38 |
| 2024 | 43 | |||||||||||
| - = No Data Reported; -- = Not Applicable; NA = Not Available; W = Withheld to avoid disclosure of individual company data. |
| Release Date: 3/29/2024 |
| Next Release Date: 4/30/2024 |