|
Download Data (XLS File) |
|
||||||||
|
||||||||
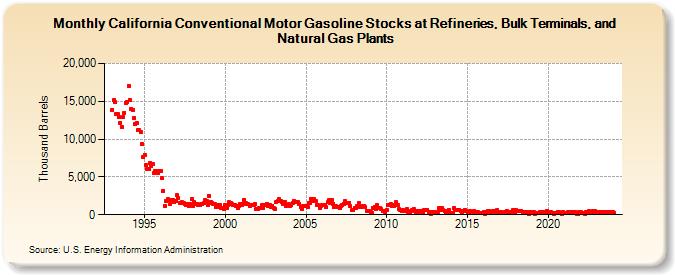
| California Conventional Motor Gasoline Stocks at Refineries, Bulk Terminals, and Natural Gas Plants (Thousand Barrels) | ||||||||
| Year | Jan | Feb | Mar | Apr | May | Jun | Jul | Aug | Sep | Oct | Nov | Dec |
|---|---|---|---|---|---|---|---|---|---|---|---|---|
| 1993 | 13,914 | 15,166 | 14,856 | 13,254 | 13,278 | 12,904 | 12,144 | 11,590 | 12,929 | 13,497 | 14,829 | 14,966 |
| 1994 | 17,024 | 15,219 | 14,006 | 13,816 | 12,759 | 12,020 | 12,133 | 11,142 | 11,155 | 10,887 | 9,359 | 7,587 |
| 1995 | 7,901 | 6,536 | 5,992 | 6,055 | 6,862 | 6,485 | 6,765 | 5,530 | 5,752 | 5,839 | 5,481 | 5,778 |
| 1996 | 5,834 | 4,832 | 3,159 | 1,217 | 1,815 | 2,063 | 1,915 | 1,380 | 1,886 | 2,000 | 1,667 | 1,809 |
| 1997 | 2,556 | 2,237 | 1,554 | 1,528 | 1,645 | 1,508 | 1,466 | 1,282 | 1,467 | 1,170 | 1,417 | 2,076 |
| 1998 | 1,192 | 1,630 | 1,354 | 1,439 | 1,292 | 1,344 | 1,358 | 1,415 | 1,491 | 1,958 | 1,871 | 1,289 |
| 1999 | 2,538 | 1,745 | 1,612 | 1,412 | 1,431 | 1,069 | 1,046 | 1,323 | 1,224 | 885 | 882 | 797 |
| 2000 | 1,346 | 909 | 1,239 | 1,631 | 1,530 | 1,422 | 1,292 | 1,284 | 1,211 | 838 | 1,153 | 1,405 |
| 2001 | 1,341 | 1,449 | 1,975 | 1,508 | 1,417 | 1,352 | 1,126 | 1,224 | 1,249 | 1,219 | 1,399 | 812 |
| 2002 | 706 | 923 | 844 | 1,247 | 949 | 1,275 | 1,302 | 1,478 | 1,147 | 1,314 | 1,068 | 1,204 |
| 2003 | 891 | 802 | 1,720 | 1,845 | 2,018 | 1,827 | 1,626 | 1,428 | 1,622 | 1,154 | 1,238 | 1,378 |
| 2004 | 1,202 | 1,245 | 1,577 | 1,834 | 1,716 | 1,686 | 1,620 | 1,388 | 1,018 | 794 | 1,140 | 1,087 |
| 2005 | 1,117 | 1,017 | 1,567 | 1,604 | 2,040 | 1,767 | 2,013 | 1,757 | 1,319 | 1,220 | 840 | 1,164 |
| 2006 | 1,271 | 1,260 | 1,331 | 1,019 | 1,641 | 1,887 | 1,606 | 1,940 | 1,482 | 1,068 | 1,106 | 1,072 |
| 2007 | 982 | 827 | 1,110 | 1,317 | 1,447 | 1,770 | 1,606 | 1,543 | 1,614 | 1,149 | 573 | 636 |
| 2008 | 919 | 832 | 1,090 | 1,564 | 1,041 | 999 | 1,167 | 1,177 | 984 | 544 | 473 | 442 |
| 2009 | 356 | 268 | 837 | 1,045 | 698 | 1,236 | 878 | 949 | 717 | 489 | 519 | 388 |
| 2010 | 648 | 1,340 | 1,308 | 1,461 | 1,181 | 1,118 | 1,348 | 1,630 | 1,252 | 743 | 582 | 514 |
| 2011 | 610 | 464 | 459 | 720 | 383 | 396 | 493 | 570 | 751 | 432 | 332 | 443 |
| 2012 | 369 | 497 | 474 | 356 | 653 | 571 | 659 | 339 | 362 | 159 | 305 | 271 |
| 2013 | 303 | 332 | 323 | 869 | 593 | 879 | 598 | 480 | 254 | 269 | 646 | 251 |
| 2014 | 267 | 209 | 912 | 569 | 597 | 652 | 640 | 523 | 370 | 485 | 680 | 441 |
| 2015 | 260 | 284 | 486 | 200 | 256 | 509 | 315 | 388 | 348 | 188 | 246 | 290 |
| 2016 | 343 | 149 | 406 | 516 | 553 | 353 | 252 | 472 | 495 | 411 | 586 | 294 |
| 2017 | 182 | 373 | 201 | 226 | 396 | 513 | 391 | 315 | 343 | 400 | 611 | 270 |
| 2018 | 576 | 483 | 482 | 519 | 504 | 394 | 338 | 406 | 301 | 357 | 140 | 358 |
| 2019 | 233 | 329 | 123 | 253 | 260 | 221 | 358 | 343 | 340 | 219 | 315 | 496 |
| 2020 | 369 | 162 | 304 | 292 | 119 | 216 | 230 | 384 | 357 | 198 | 124 | 314 |
| 2021 | 287 | 285 | 291 | 367 | 369 | 273 | 359 | 163 | 381 | 154 | 126 | 372 |
| 2022 | 315 | 279 | 192 | 138 | 409 | 377 | 453 | 161 | 282 | 512 | 198 | 442 |
| 2023 | 390 | 218 | 323 | 404 | 410 | 356 | 280 | 347 | 391 | 353 | 303 | 226 |
| 2024 | 364 | |||||||||||
| - = No Data Reported; -- = Not Applicable; NA = Not Available; W = Withheld to avoid disclosure of individual company data. |
| Release Date: 3/29/2024 |
| Next Release Date: 4/30/2024 |