|
Download Data (XLS File) |
|
||||||||
|
||||||||
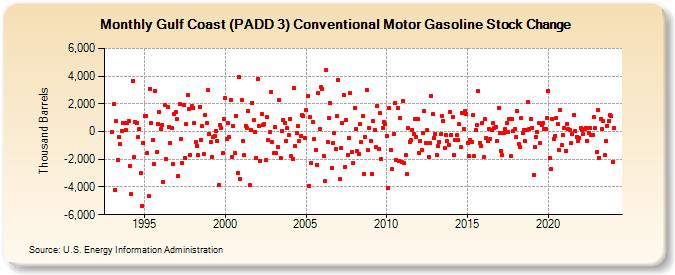
| Gulf Coast (PADD 3) Conventional Motor Gasoline Stock Change (Thousand Barrels) | ||||||||
| Year | Jan | Feb | Mar | Apr | May | Jun | Jul | Aug | Sep | Oct | Nov | Dec |
|---|---|---|---|---|---|---|---|---|---|---|---|---|
| 1993 | 0 | 1,992 | -4,211 | 736 | -2,023 | -405 | -906 | 66 | 625 | 613 | 115 | 637 |
| 1994 | 786 | -2,451 | -4,500 | 3,649 | -1,857 | 715 | 628 | -414 | 156 | -2,992 | -5,338 | -851 |
| 1995 | 1,108 | 1,126 | -1,576 | -4,657 | 3,094 | 605 | -592 | -2,324 | 2,937 | -1,508 | 569 | 1,423 |
| 1996 | 173 | 494 | -3,650 | 1,881 | -2,000 | 1,766 | 317 | -820 | 224 | -2,333 | 1,241 | 1,398 |
| 1997 | 897 | -3,198 | 1,991 | -508 | -2,269 | 1,947 | -1,896 | 557 | 2,617 | 1,634 | -1,688 | 1,856 |
| 1998 | 1,720 | 607 | -751 | -1,016 | -1,713 | 1,806 | -598 | 378 | -1,592 | 1,183 | 597 | 3,005 |
| 1999 | -147 | -783 | -1,811 | -409 | -299 | 60 | -665 | -3,882 | 499 | 222 | -1,552 | 924 |
| 2000 | 2,423 | -546 | 646 | -358 | 2,295 | -1,803 | 393 | -1,542 | 1,125 | -2,966 | 3,947 | -3,434 |
| 2001 | 2,292 | -712 | -1,726 | 432 | 283 | 1,478 | -3,879 | 89 | 2,085 | 802 | -2 | -1,893 |
| 2002 | 3,803 | 419 | -2,090 | 1,292 | 487 | 572 | -2,088 | 1,059 | -617 | -6 | 2,850 | -760 |
| 2003 | -1,552 | 306 | -1,582 | -1,121 | 2,259 | -1,901 | 62 | 854 | 617 | -678 | 228 | -273 |
| 2004 | 911 | -1,798 | -2,001 | 3,132 | -1,057 | -117 | 408 | -697 | -310 | 1,180 | 1,120 | -464 |
| 2005 | 1,529 | 2,533 | -3,893 | 1,027 | -2,253 | 695 | -554 | -1,317 | -2,400 | 2,755 | 169 | 3,186 |
| 2006 | 3,048 | -1,735 | -3,603 | 4,424 | -737 | 989 | 2,055 | -2,622 | -854 | -136 | -1,264 | 1,088 |
| 2007 | 3,727 | -3,452 | -1,174 | 633 | 2,665 | -2,533 | 849 | -1,687 | -454 | 2,753 | -1,459 | -2,239 |
| 2008 | 1,708 | 194 | -1,370 | -1,632 | 558 | -781 | 1,093 | -3,042 | -418 | 3,003 | -1,364 | 282 |
| 2009 | -670 | -3,074 | 761 | 148 | -1,116 | 1,862 | -1,260 | 1,366 | -1,998 | 284 | 664 | 522 |
| 2010 | -292 | -4,044 | 1,686 | -1,331 | -2,696 | -166 | 2,024 | -2,024 | 1,708 | -2,099 | 980 | -2,163 |
| 2011 | 2,227 | -2,278 | -1,718 | -3,094 | 261 | -724 | -613 | 140 | -166 | 927 | -379 | 928 |
| 2012 | -1,558 | -670 | -1,350 | -98 | 1,461 | -810 | 77 | -1,804 | -817 | 2,599 | 1,235 | -501 |
| 2013 | -142 | -1,689 | -1,064 | -765 | -196 | 1,129 | 735 | -1,185 | -238 | -711 | -936 | 1,414 |
| 2014 | -257 | 1,034 | -1,681 | -600 | -281 | -577 | 527 | -1,144 | 1,357 | 214 | 1,452 | 1,231 |
| 2015 | -826 | -1,749 | -601 | -744 | 1,171 | -1,770 | 110 | 444 | 2,907 | -793 | -1,032 | 652 |
| 2016 | -1,851 | 871 | -464 | -687 | 164 | -539 | 129 | 606 | 291 | 362 | -651 | 1,727 |
| 2017 | -79 | -1,404 | -1,698 | -125 | 177 | 599 | -24 | 927 | -1,772 | 898 | 22 | 217 |
| 2018 | -359 | 1,498 | -864 | -1,125 | 966 | -134 | 131 | -682 | 102 | 2,142 | 158 | 882 |
| 2019 | 291 | -3,111 | -1,082 | -357 | -41 | 607 | -837 | 473 | 643 | 151 | 168 | 998 |
| 2020 | 2,913 | -1,912 | -2,711 | 882 | -539 | -304 | 972 | 549 | -1,336 | 1,538 | -997 | -264 |
| 2021 | 222 | -1,380 | 572 | 203 | 148 | -838 | -194 | 1,218 | 22 | -395 | -711 | -443 |
| 2022 | 263 | 139 | -176 | 171 | 283 | -706 | -70 | 292 | -245 | -258 | 1,029 | 277 |
| 2023 | -1,491 | 1,551 | -1,878 | 912 | 209 | 756 | -1,722 | -708 | 420 | 744 | 1,169 | 1,087 |
| 2024 | -2,199 | |||||||||||
| - = No Data Reported; -- = Not Applicable; NA = Not Available; W = Withheld to avoid disclosure of individual company data. |
| Release Date: 3/29/2024 |
| Next Release Date: 4/30/2024 |