|
Download Data (XLS File) |
|
||||||||
|
||||||||
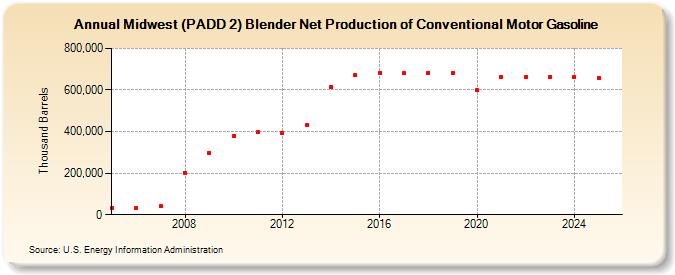
| Midwest (PADD 2) Blender Net Production of Conventional Motor Gasoline (Thousand Barrels) | ||||||||
| Decade | Year-0 | Year-1 | Year-2 | Year-3 | Year-4 | Year-5 | Year-6 | Year-7 | Year-8 | Year-9 |
|---|---|---|---|---|---|---|---|---|---|---|
| 2000's | 30,166 | 32,870 | 39,916 | 202,865 | 295,874 | |||||
| 2010's | 378,597 | 399,303 | 392,048 | 432,294 | 613,247 | 672,654 | 682,521 | 679,933 | 683,522 | 680,534 |
| 2020's | 598,624 | 664,017 | 663,434 | 662,452 |
| - = No Data Reported; -- = Not Applicable; NA = Not Available; W = Withheld to avoid disclosure of individual company data. |
| Release Date: 8/30/2024 |
| Next Release Date: 8/29/2025 |