|
Download Data (XLS File) |
|
||||||||
|
||||||||
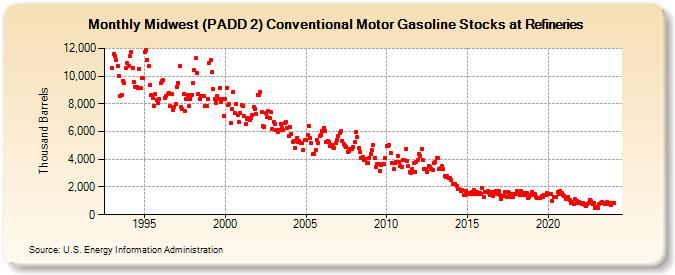
| Midwest (PADD 2) Conventional Motor Gasoline Stocks at Refineries (Thousand Barrels) | ||||||||
| Year | Jan | Feb | Mar | Apr | May | Jun | Jul | Aug | Sep | Oct | Nov | Dec |
|---|---|---|---|---|---|---|---|---|---|---|---|---|
| 1993 | 10,560 | 11,606 | 11,437 | 11,129 | 10,715 | 10,035 | 8,541 | 8,637 | 9,669 | 9,528 | 10,578 | 10,935 |
| 1994 | 10,710 | 11,449 | 11,720 | 10,621 | 9,611 | 9,230 | 9,237 | 9,112 | 10,531 | 9,148 | 9,889 | 9,872 |
| 1995 | 11,739 | 11,864 | 11,161 | 10,709 | 9,387 | 8,615 | 8,414 | 7,876 | 8,705 | 8,264 | 8,028 | 8,343 |
| 1996 | 9,508 | 9,637 | 9,726 | 8,444 | 8,575 | 8,700 | 8,797 | 7,841 | 8,694 | 7,558 | 7,793 | 7,957 |
| 1997 | 9,235 | 9,502 | 10,720 | 7,754 | 7,599 | 8,705 | 7,469 | 8,340 | 8,614 | 7,835 | 8,376 | 8,669 |
| 1998 | 9,530 | 10,455 | 11,275 | 10,207 | 8,705 | 8,328 | 8,544 | 8,595 | 8,558 | 7,819 | 7,865 | 8,369 |
| 1999 | 10,910 | 11,151 | 10,275 | 9,052 | 8,341 | 8,064 | 8,549 | 8,355 | 9,127 | 8,146 | 8,371 | 7,132 |
| 2000 | 8,321 | 9,147 | 7,902 | 8,008 | 6,606 | 7,605 | 8,838 | 7,352 | 7,997 | 7,164 | 6,678 | 7,366 |
| 2001 | 7,891 | 7,868 | 7,112 | 6,516 | 6,900 | 6,951 | 6,860 | 6,947 | 7,171 | 7,767 | 7,619 | 7,254 |
| 2002 | 8,667 | 8,627 | 8,835 | 7,391 | 6,417 | 6,355 | 7,317 | 7,059 | 7,477 | 6,953 | 7,394 | 6,198 |
| 2003 | 6,711 | 6,551 | 6,138 | 5,933 | 6,144 | 6,570 | 6,264 | 6,102 | 6,651 | 6,719 | 6,258 | 5,704 |
| 2004 | 6,349 | 5,848 | 5,282 | 5,338 | 4,796 | 5,540 | 5,214 | 5,306 | 5,206 | 5,147 | 4,693 | 5,418 |
| 2005 | 5,389 | 5,757 | 6,414 | 5,551 | 5,144 | 4,359 | 4,350 | 4,666 | 5,401 | 5,203 | 5,705 | 5,723 |
| 2006 | 6,068 | 6,274 | 6,049 | 5,282 | 5,310 | 5,230 | 4,981 | 5,013 | 4,903 | 4,824 | 5,191 | 5,379 |
| 2007 | 5,644 | 5,926 | 6,024 | 5,329 | 5,112 | 4,945 | 4,904 | 4,557 | 4,595 | 4,756 | 4,764 | 4,917 |
| 2008 | 5,228 | 5,937 | 5,628 | 4,823 | 4,529 | 4,102 | 4,161 | 3,948 | 4,013 | 3,712 | 3,759 | 4,118 |
| 2009 | 4,372 | 4,703 | 5,041 | 4,093 | 3,467 | 3,623 | 3,691 | 3,166 | 3,579 | 3,693 | 3,630 | 4,118 |
| 2010 | 4,925 | 4,956 | 5,055 | 4,467 | 3,703 | 3,297 | 3,721 | 3,788 | 4,218 | 3,838 | 3,534 | 3,474 |
| 2011 | 3,941 | 3,938 | 4,727 | 3,898 | 3,524 | 3,105 | 3,013 | 3,327 | 3,731 | 3,092 | 3,795 | 3,959 |
| 2012 | 4,348 | 4,248 | 4,734 | 3,926 | 3,301 | 3,302 | 3,090 | 3,508 | 3,459 | 3,300 | 3,210 | 3,741 |
| 2013 | 3,782 | 4,108 | 4,056 | 3,323 | 3,360 | 3,516 | 3,299 | 2,816 | 2,689 | 2,796 | 2,669 | 2,615 |
| 2014 | 2,472 | 2,189 | 2,213 | 2,247 | 2,037 | 1,835 | 1,820 | 1,690 | 1,819 | 1,454 | 1,450 | 1,723 |
| 2015 | 1,582 | 1,530 | 1,583 | 1,630 | 1,492 | 1,751 | 1,471 | 1,665 | 1,511 | 1,580 | 1,478 | 1,900 |
| 2016 | 1,278 | 1,658 | 1,672 | 1,680 | 1,587 | 1,424 | 1,617 | 1,362 | 1,650 | 1,706 | 1,471 | 1,708 |
| 2017 | 1,448 | 1,123 | 1,328 | 1,326 | 1,621 | 1,312 | 1,609 | 1,555 | 1,313 | 1,463 | 1,308 | 1,475 |
| 2018 | 1,526 | 1,677 | 1,531 | 1,444 | 1,686 | 1,409 | 1,596 | 1,430 | 1,543 | 1,196 | 1,301 | 1,412 |
| 2019 | 1,605 | 1,390 | 1,497 | 1,309 | 1,193 | 1,211 | 1,240 | 1,384 | 1,293 | 1,413 | 1,431 | 1,552 |
| 2020 | 1,486 | 1,475 | 1,492 | 962 | 1,297 | 1,267 | 1,291 | 1,654 | 1,519 | 1,678 | 1,544 | 1,448 |
| 2021 | 1,355 | 1,114 | 1,221 | 1,251 | 1,087 | 822 | 948 | 744 | 1,111 | 957 | 838 | 895 |
| 2022 | 845 | 760 | 849 | 725 | 616 | 751 | 876 | 1,052 | 960 | 750 | 858 | 490 |
| 2023 | 585 | 462 | 797 | 810 | 892 | 836 | 737 | 855 | 928 | 794 | 842 | 733 |
| 2024 | 818 | |||||||||||
| - = No Data Reported; -- = Not Applicable; NA = Not Available; W = Withheld to avoid disclosure of individual company data. |
| Release Date: 3/29/2024 |
| Next Release Date: 4/30/2024 |