|
Download Data (XLS File) |
|
||||||||
|
||||||||
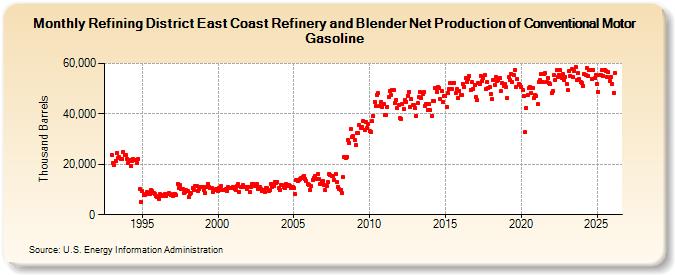
| Refining District East Coast Refinery and Blender Net Production of Conventional Motor Gasoline (Thousand Barrels) | ||||||||
| Year | Jan | Feb | Mar | Apr | May | Jun | Jul | Aug | Sep | Oct | Nov | Dec |
|---|---|---|---|---|---|---|---|---|---|---|---|---|
| 1993 | 23,701 | 20,675 | 19,787 | 21,499 | 24,655 | 22,601 | 22,778 | 22,146 | 22,190 | 24,796 | 23,538 | 23,611 |
| 1994 | 22,227 | 20,597 | 21,553 | 19,355 | 21,133 | 21,943 | 21,525 | 21,729 | 20,551 | 22,135 | 10,018 | 5,136 |
| 1995 | 9,368 | 7,703 | 7,690 | 8,247 | 9,059 | 8,462 | 8,323 | 9,778 | 9,290 | 8,673 | 8,368 | 7,389 |
| 1996 | 6,850 | 6,311 | 8,132 | 7,596 | 7,825 | 7,424 | 8,230 | 7,450 | 8,027 | 8,593 | 8,148 | 7,770 |
| 1997 | 7,536 | 8,208 | 8,302 | 7,817 | 12,328 | 10,634 | 11,635 | 10,145 | 10,052 | 8,492 | 8,998 | 9,624 |
| 1998 | 9,281 | 6,905 | 8,052 | 8,774 | 10,503 | 9,853 | 11,375 | 11,225 | 9,551 | 10,216 | 10,996 | 10,861 |
| 1999 | 11,170 | 9,702 | 8,435 | 11,176 | 12,291 | 10,880 | 10,518 | 10,686 | 9,157 | 9,957 | 10,023 | 9,969 |
| 2000 | 9,532 | 10,599 | 11,256 | 9,959 | 9,873 | 9,913 | 10,090 | 9,294 | 10,826 | 10,704 | 10,484 | 10,573 |
| 2001 | 11,160 | 10,376 | 9,928 | 11,223 | 12,158 | 9,140 | 10,960 | 10,887 | 11,648 | 11,163 | 10,813 | 10,347 |
| 2002 | 11,003 | 9,124 | 11,000 | 12,004 | 12,358 | 11,413 | 11,333 | 12,038 | 10,287 | 11,181 | 10,220 | 9,296 |
| 2003 | 9,808 | 9,038 | 10,459 | 10,402 | 9,443 | 9,950 | 12,339 | 11,083 | 11,285 | 12,890 | 12,667 | 13,105 |
| 2004 | 10,428 | 9,922 | 11,708 | 11,599 | 10,934 | 10,499 | 12,317 | 11,235 | 11,689 | 11,524 | 10,708 | 11,193 |
| 2005 | 10,409 | 8,049 | 13,912 | 13,364 | 13,838 | 14,016 | 14,760 | 14,980 | 15,529 | 14,135 | 13,307 | 12,065 |
| 2006 | 11,987 | 9,974 | 11,217 | 13,835 | 14,614 | 15,188 | 14,209 | 16,024 | 14,224 | 12,240 | 13,090 | 13,436 |
| 2007 | 11,812 | 9,628 | 11,251 | 12,933 | 16,311 | 15,709 | 15,163 | 15,482 | 13,910 | 16,087 | 13,168 | 11,125 |
| 2008 | 10,087 | 9,925 | 8,501 | 14,907 | 22,975 | 22,698 | 22,816 | 29,540 | 28,530 | 34,025 | 30,962 | 31,263 |
| 2009 | 29,692 | 27,614 | 32,524 | 32,451 | 35,422 | 34,563 | 34,989 | 36,998 | 33,604 | 36,734 | 34,590 | 36,179 |
| 2010 | 33,037 | 32,631 | 37,024 | 39,107 | 44,838 | 43,022 | 47,490 | 48,173 | 43,112 | 44,898 | 42,566 | 43,903 |
| 2011 | 39,625 | 39,488 | 42,851 | 46,558 | 49,131 | 47,468 | 49,415 | 49,632 | 44,329 | 45,510 | 42,444 | 43,530 |
| 2012 | 38,225 | 38,095 | 43,951 | 42,119 | 45,629 | 44,876 | 47,282 | 48,759 | 42,778 | 45,763 | 43,426 | 43,561 |
| 2013 | 42,251 | 39,048 | 44,156 | 46,692 | 48,631 | 46,383 | 47,924 | 48,549 | 43,239 | 43,924 | 41,546 | 43,821 |
| 2014 | 41,522 | 39,077 | 45,260 | 45,141 | 50,243 | 48,857 | 50,672 | 50,399 | 45,761 | 48,955 | 44,630 | 46,931 |
| 2015 | 46,918 | 42,562 | 48,118 | 49,719 | 52,444 | 50,039 | 52,242 | 52,431 | 48,158 | 49,746 | 46,477 | 49,261 |
| 2016 | 47,412 | 47,632 | 52,019 | 50,838 | 54,071 | 52,848 | 53,999 | 55,070 | 49,671 | 52,490 | 49,880 | 51,313 |
| 2017 | 46,717 | 45,453 | 52,270 | 52,025 | 55,071 | 52,856 | 54,293 | 55,413 | 49,784 | 52,667 | 50,112 | 50,675 |
| 2018 | 47,929 | 45,863 | 53,327 | 51,538 | 54,478 | 53,201 | 53,290 | 54,419 | 48,904 | 52,208 | 51,011 | 51,898 |
| 2019 | 50,626 | 46,220 | 54,667 | 53,357 | 55,940 | 52,613 | 55,409 | 57,351 | 50,843 | 53,837 | 51,956 | 51,647 |
| 2020 | 50,687 | 49,340 | 47,223 | 32,713 | 42,466 | 47,349 | 50,116 | 50,743 | 48,094 | 50,464 | 46,183 | 47,472 |
| 2021 | 47,145 | 43,766 | 52,632 | 53,419 | 55,637 | 52,555 | 55,902 | 56,147 | 52,659 | 54,341 | 52,273 | 51,674 |
| 2022 | 48,246 | 48,892 | 55,253 | 53,436 | 57,220 | 54,700 | 55,542 | 57,409 | 54,220 | 55,709 | 53,414 | 54,826 |
| 2023 | 51,878 | 49,179 | 56,908 | 55,002 | 57,557 | 54,705 | 57,127 | 58,531 | 53,393 | 56,189 | 53,659 | 52,485 |
| 2024 | 52,280 | |||||||||||
| - = No Data Reported; -- = Not Applicable; NA = Not Available; W = Withheld to avoid disclosure of individual company data. |
| Release Date: 3/29/2024 |
| Next Release Date: 4/30/2024 |