|
Download Data (XLS File) |
|
||||||||
|
||||||||
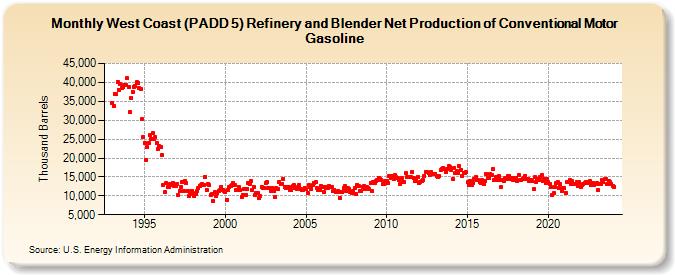
| West Coast (PADD 5) Refinery and Blender Net Production of Conventional Motor Gasoline (Thousand Barrels) | ||||||||
| Year | Jan | Feb | Mar | Apr | May | Jun | Jul | Aug | Sep | Oct | Nov | Dec |
|---|---|---|---|---|---|---|---|---|---|---|---|---|
| 1993 | 34,556 | 33,773 | 36,996 | 36,847 | 40,038 | 38,062 | 39,506 | 38,526 | 38,657 | 39,378 | 39,314 | 41,045 |
| 1994 | 38,884 | 32,207 | 35,855 | 37,541 | 38,907 | 38,962 | 39,991 | 39,935 | 38,403 | 38,331 | 30,243 | 25,638 |
| 1995 | 23,973 | 19,448 | 22,896 | 24,073 | 25,997 | 25,058 | 26,551 | 24,937 | 25,503 | 23,939 | 22,508 | 23,135 |
| 1996 | 22,911 | 20,852 | 12,943 | 10,946 | 13,501 | 12,430 | 12,365 | 13,177 | 12,830 | 13,468 | 12,507 | 12,697 |
| 1997 | 13,249 | 10,124 | 11,231 | 12,410 | 13,600 | 11,219 | 13,883 | 13,315 | 11,359 | 9,930 | 10,397 | 11,347 |
| 1998 | 10,622 | 9,821 | 10,544 | 11,233 | 12,032 | 12,679 | 12,750 | 13,086 | 12,767 | 15,092 | 11,605 | 13,229 |
| 1999 | 12,820 | 10,176 | 10,390 | 8,613 | 10,925 | 9,821 | 10,703 | 11,290 | 11,533 | 12,363 | 11,632 | 11,202 |
| 2000 | 11,059 | 9,006 | 11,522 | 12,444 | 12,664 | 12,829 | 13,339 | 12,838 | 11,409 | 11,579 | 12,328 | 11,430 |
| 2001 | 9,738 | 10,343 | 11,721 | 10,343 | 11,862 | 13,292 | 13,050 | 13,860 | 11,621 | 12,338 | 10,322 | 10,838 |
| 2002 | 10,627 | 9,446 | 9,849 | 12,346 | 12,192 | 12,122 | 13,453 | 13,521 | 12,187 | 12,084 | 11,145 | 11,938 |
| 2003 | 11,172 | 9,709 | 12,013 | 11,857 | 13,682 | 13,071 | 13,245 | 14,458 | 12,409 | 12,192 | 12,443 | 12,429 |
| 2004 | 11,608 | 11,427 | 12,514 | 12,791 | 12,080 | 11,817 | 12,316 | 12,827 | 11,741 | 11,454 | 11,468 | 12,156 |
| 2005 | 11,725 | 10,673 | 12,788 | 12,391 | 11,877 | 12,771 | 13,260 | 13,534 | 11,973 | 11,623 | 11,491 | 12,656 |
| 2006 | 12,250 | 11,068 | 12,351 | 12,088 | 12,043 | 12,629 | 12,234 | 12,304 | 11,170 | 11,645 | 10,932 | 10,978 |
| 2007 | 11,325 | 9,413 | 10,894 | 11,011 | 11,951 | 12,504 | 11,286 | 12,096 | 11,697 | 11,135 | 10,669 | 11,404 |
| 2008 | 11,944 | 10,543 | 12,893 | 12,607 | 11,214 | 11,152 | 12,391 | 12,684 | 11,886 | 12,394 | 12,020 | 11,725 |
| 2009 | 13,305 | 11,172 | 13,713 | 13,373 | 13,815 | 14,109 | 14,829 | 14,535 | 14,306 | 13,208 | 13,202 | 13,813 |
| 2010 | 13,825 | 13,441 | 15,202 | 14,650 | 15,172 | 14,406 | 15,418 | 14,864 | 14,663 | 14,250 | 13,135 | 14,694 |
| 2011 | 13,723 | 13,782 | 15,916 | 14,950 | 14,866 | 15,063 | 14,962 | 16,335 | 14,622 | 13,808 | 14,308 | 14,946 |
| 2012 | 13,440 | 13,746 | 14,030 | 14,063 | 15,221 | 16,373 | 16,185 | 15,923 | 15,527 | 16,264 | 15,675 | 15,888 |
| 2013 | 15,884 | 15,108 | 15,067 | 15,235 | 16,732 | 17,221 | 17,442 | 17,026 | 16,328 | 17,055 | 17,787 | 17,507 |
| 2014 | 16,787 | 14,486 | 17,409 | 15,917 | 16,686 | 16,114 | 17,785 | 16,952 | 15,269 | 16,053 | 16,090 | 16,249 |
| 2015 | 13,541 | 12,847 | 14,044 | 12,988 | 13,440 | 14,524 | 14,961 | 14,306 | 14,142 | 13,619 | 13,300 | 14,080 |
| 2016 | 13,148 | 13,874 | 15,777 | 14,729 | 14,823 | 15,725 | 15,372 | 17,002 | 14,187 | 14,857 | 14,159 | 15,221 |
| 2017 | 14,279 | 12,342 | 14,209 | 14,014 | 14,652 | 14,578 | 15,249 | 15,256 | 14,506 | 14,817 | 14,189 | 14,607 |
| 2018 | 14,709 | 13,896 | 15,384 | 14,065 | 14,159 | 14,528 | 14,833 | 15,316 | 14,399 | 14,519 | 13,849 | 14,146 |
| 2019 | 13,946 | 11,672 | 14,904 | 13,527 | 14,446 | 14,070 | 15,009 | 15,372 | 13,895 | 14,562 | 13,377 | 14,490 |
| 2020 | 13,664 | 13,202 | 12,306 | 10,238 | 10,622 | 12,415 | 13,485 | 13,698 | 12,120 | 13,053 | 11,242 | 12,115 |
| 2021 | 12,062 | 10,809 | 13,698 | 13,713 | 14,189 | 13,234 | 13,840 | 13,122 | 13,082 | 13,564 | 12,649 | 13,596 |
| 2022 | 12,349 | 12,846 | 13,127 | 13,426 | 13,717 | 13,397 | 13,618 | 13,833 | 12,747 | 13,264 | 12,772 | 13,029 |
| 2023 | 13,393 | 11,598 | 13,086 | 13,208 | 14,198 | 13,619 | 14,341 | 14,415 | 13,082 | 13,957 | 13,545 | 13,198 |
| 2024 | 12,719 | |||||||||||
| - = No Data Reported; -- = Not Applicable; NA = Not Available; W = Withheld to avoid disclosure of individual company data. |
| Release Date: 3/29/2024 |
| Next Release Date: 4/30/2024 |