|
Download Data (XLS File) |
|
||||||||
|
||||||||
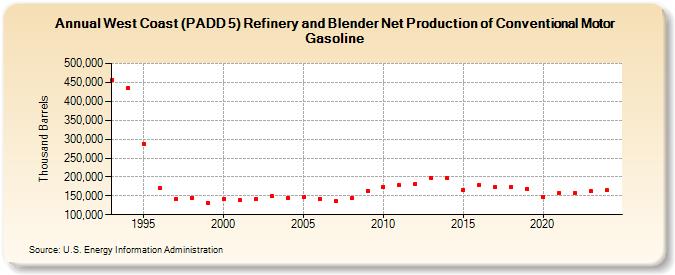
| West Coast (PADD 5) Refinery and Blender Net Production of Conventional Motor Gasoline (Thousand Barrels) | ||||||||
| Decade | Year-0 | Year-1 | Year-2 | Year-3 | Year-4 | Year-5 | Year-6 | Year-7 | Year-8 | Year-9 |
|---|---|---|---|---|---|---|---|---|---|---|
| 1990's | 456,698 | 434,897 | 288,018 | 170,627 | 142,064 | 145,460 | 131,468 | |||
| 2000's | 142,447 | 139,328 | 140,910 | 148,680 | 144,199 | 146,762 | 141,692 | 135,385 | 143,453 | 163,380 |
| 2010's | 173,720 | 177,281 | 182,335 | 198,392 | 195,797 | 165,792 | 178,874 | 172,698 | 173,803 | 169,270 |
| 2020's | 148,160 | 157,558 | 158,125 | 161,640 |
| - = No Data Reported; -- = Not Applicable; NA = Not Available; W = Withheld to avoid disclosure of individual company data. |
| Release Date: 3/29/2024 |
| Next Release Date: 8/30/2024 |