|
Download Data (XLS File) |
|
||||||||
|
||||||||
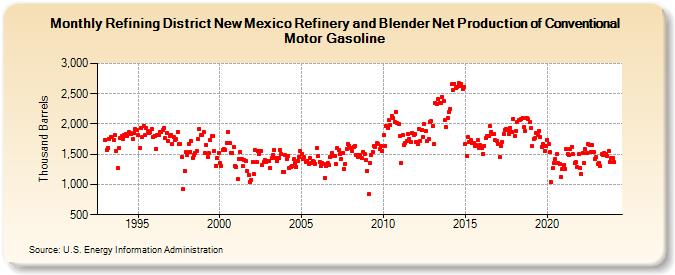
| Refining District New Mexico Refinery and Blender Net Production of Conventional Motor Gasoline (Thousand Barrels) | ||||||||
| Year | Jan | Feb | Mar | Apr | May | Jun | Jul | Aug | Sep | Oct | Nov | Dec |
|---|---|---|---|---|---|---|---|---|---|---|---|---|
| 1993 | 1,731 | 1,570 | 1,603 | 1,745 | 1,785 | 1,787 | 1,742 | 1,812 | 1,550 | 1,264 | 1,609 | 1,772 |
| 1994 | 1,793 | 1,756 | 1,820 | 1,837 | 1,799 | 1,860 | 1,854 | 1,828 | 1,745 | 1,848 | 1,913 | 1,903 |
| 1995 | 1,823 | 1,595 | 1,932 | 1,781 | 1,970 | 1,814 | 1,937 | 1,887 | 1,844 | 1,860 | 1,925 | 1,784 |
| 1996 | 1,807 | 1,592 | 1,822 | 1,816 | 1,867 | 1,875 | 1,895 | 1,933 | 1,763 | 1,844 | 1,715 | 1,798 |
| 1997 | 1,824 | 1,669 | 1,787 | 1,733 | 1,745 | 1,874 | 1,663 | 1,670 | 1,448 | 917 | 1,224 | 1,537 |
| 1998 | 1,491 | 1,677 | 1,542 | 1,715 | 1,445 | 1,488 | 1,528 | 1,551 | 1,749 | 1,920 | 1,815 | 1,826 |
| 1999 | 1,861 | 1,526 | 1,657 | 1,448 | 1,514 | 1,739 | 1,797 | 1,807 | 1,552 | 1,306 | 1,433 | 1,520 |
| 2000 | 1,350 | 1,305 | 1,571 | 1,585 | 1,575 | 1,692 | 1,871 | 1,678 | 1,521 | 1,525 | 1,625 | 1,310 |
| 2001 | 1,290 | 1,085 | 1,425 | 1,534 | 1,419 | 1,300 | 1,405 | 1,382 | 1,216 | 1,164 | 1,049 | 1,076 |
| 2002 | 1,368 | 1,167 | 1,562 | 1,379 | 1,551 | 1,502 | 1,550 | 1,330 | 1,367 | 1,404 | 1,364 | 1,386 |
| 2003 | 1,387 | 1,269 | 1,439 | 1,488 | 1,573 | 1,443 | 1,396 | 1,437 | 1,572 | 1,504 | 1,214 | 1,209 |
| 2004 | 1,479 | 1,423 | 1,473 | 1,264 | 1,295 | 1,302 | 1,415 | 1,351 | 1,296 | 1,395 | 1,461 | 1,548 |
| 2005 | 1,510 | 1,427 | 1,447 | 1,365 | 1,380 | 1,346 | 1,435 | 1,355 | 1,386 | 1,373 | 1,342 | 1,605 |
| 2006 | 1,471 | 1,378 | 1,303 | 1,351 | 1,342 | 1,107 | 1,303 | 1,359 | 1,316 | 1,452 | 1,520 | 1,477 |
| 2007 | 1,472 | 1,338 | 1,606 | 1,572 | 1,510 | 1,427 | 1,522 | 1,261 | 1,346 | 1,591 | 1,667 | 1,641 |
| 2008 | 1,605 | 1,547 | 1,620 | 1,637 | 1,489 | 1,456 | 1,493 | 1,493 | 1,441 | 1,544 | 1,507 | 1,401 |
| 2009 | 1,227 | 837 | 1,360 | 1,480 | 1,535 | 1,640 | 1,627 | 1,680 | 1,662 | 1,582 | 1,641 | 1,556 |
| 2010 | 1,823 | 1,640 | 1,962 | 1,929 | 2,064 | 1,981 | 2,136 | 2,091 | 2,032 | 2,198 | 2,013 | 2,007 |
| 2011 | 1,800 | 1,363 | 1,821 | 1,657 | 1,691 | 1,719 | 1,838 | 1,756 | 1,709 | 1,853 | 1,820 | 1,835 |
| 2012 | 1,704 | 1,666 | 1,918 | 1,721 | 1,898 | 1,791 | 2,002 | 1,878 | 1,726 | 1,749 | 2,027 | 2,043 |
| 2013 | 1,969 | 1,672 | 2,349 | 2,329 | 2,408 | 2,343 | 2,351 | 2,452 | 2,381 | 2,063 | 1,954 | 2,104 |
| 2014 | 2,201 | 2,250 | 2,656 | 2,566 | 2,667 | 2,591 | 2,606 | 2,672 | 2,629 | 2,668 | 2,581 | 2,610 |
| 2015 | 1,663 | 1,469 | 1,779 | 1,703 | 1,731 | 1,679 | 1,689 | 1,636 | 1,648 | 1,733 | 1,598 | 1,651 |
| 2016 | 1,611 | 1,509 | 1,638 | 1,762 | 1,801 | 1,797 | 1,964 | 1,873 | 1,829 | 1,838 | 1,731 | 1,717 |
| 2017 | 1,667 | 1,456 | 1,644 | 1,710 | 1,841 | 1,900 | 1,913 | 1,897 | 1,835 | 1,941 | 1,875 | 2,089 |
| 2018 | 1,804 | 1,877 | 2,027 | 2,059 | 2,067 | 2,077 | 2,107 | 1,942 | 1,879 | 2,097 | 2,082 | 2,036 |
| 2019 | 1,930 | 1,629 | 1,753 | 1,760 | 1,845 | 1,825 | 1,889 | 1,788 | 1,625 | 1,662 | 1,553 | 1,628 |
| 2020 | 1,743 | 1,672 | 1,544 | 1,035 | 1,267 | 1,350 | 1,424 | 1,500 | 1,358 | 1,338 | 1,127 | 1,250 |
| 2021 | 1,316 | 1,254 | 1,579 | 1,500 | 1,484 | 1,579 | 1,620 | 1,500 | 1,360 | 1,364 | 1,284 | 1,497 |
| 2022 | 1,274 | 1,181 | 1,516 | 1,353 | 1,579 | 1,519 | 1,672 | 1,653 | 1,543 | 1,655 | 1,530 | 1,428 |
| 2023 | 1,446 | 1,339 | 1,362 | 1,308 | 1,498 | 1,488 | 1,519 | 1,511 | 1,475 | 1,557 | 1,371 | 1,444 |
| 2024 | 1,433 | |||||||||||
| - = No Data Reported; -- = Not Applicable; NA = Not Available; W = Withheld to avoid disclosure of individual company data. |
| Release Date: 3/29/2024 |
| Next Release Date: 4/30/2024 |