|
Download Data (XLS File) |
|
||||||||
|
||||||||
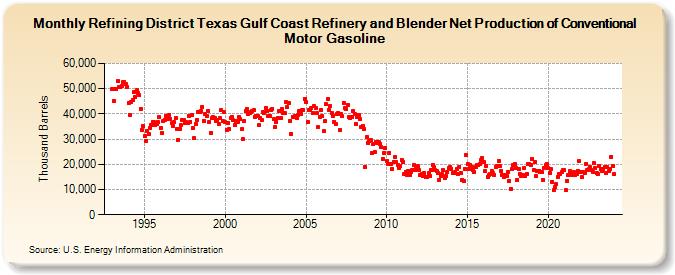
| Refining District Texas Gulf Coast Refinery and Blender Net Production of Conventional Motor Gasoline (Thousand Barrels) | ||||||||
| Year | Jan | Feb | Mar | Apr | May | Jun | Jul | Aug | Sep | Oct | Nov | Dec |
|---|---|---|---|---|---|---|---|---|---|---|---|---|
| 1993 | 49,953 | 45,116 | 49,971 | 49,679 | 52,961 | 50,686 | 50,640 | 51,166 | 52,619 | 52,584 | 51,903 | 50,771 |
| 1994 | 44,377 | 39,606 | 44,790 | 45,700 | 48,503 | 46,720 | 49,332 | 48,464 | 47,480 | 42,054 | 33,807 | 35,209 |
| 1995 | 31,138 | 29,363 | 33,020 | 31,911 | 34,536 | 35,590 | 36,823 | 36,748 | 35,407 | 36,117 | 36,607 | 38,623 |
| 1996 | 34,421 | 32,434 | 37,197 | 37,741 | 39,214 | 38,091 | 39,515 | 38,139 | 36,262 | 35,302 | 36,598 | 38,274 |
| 1997 | 34,090 | 29,731 | 34,181 | 35,424 | 37,688 | 37,488 | 36,298 | 36,671 | 36,226 | 39,246 | 36,961 | 39,612 |
| 1998 | 34,464 | 30,311 | 35,935 | 37,715 | 40,862 | 40,589 | 41,091 | 42,769 | 37,293 | 39,824 | 39,222 | 41,181 |
| 1999 | 36,917 | 32,616 | 38,200 | 38,569 | 38,521 | 37,055 | 37,515 | 36,178 | 38,286 | 41,414 | 36,997 | 40,619 |
| 2000 | 36,738 | 33,630 | 36,416 | 34,004 | 38,424 | 38,708 | 37,395 | 35,549 | 37,308 | 36,943 | 38,757 | 37,930 |
| 2001 | 33,900 | 29,922 | 36,998 | 41,096 | 42,067 | 39,804 | 40,501 | 40,796 | 41,083 | 41,359 | 38,954 | 39,085 |
| 2002 | 39,182 | 35,461 | 38,358 | 37,722 | 40,751 | 40,500 | 42,417 | 41,299 | 39,313 | 39,150 | 41,573 | 42,048 |
| 2003 | 37,860 | 34,995 | 36,903 | 38,186 | 41,113 | 38,373 | 41,975 | 40,451 | 40,537 | 44,805 | 42,697 | 44,169 |
| 2004 | 37,194 | 32,059 | 38,851 | 38,864 | 39,032 | 38,449 | 39,395 | 41,057 | 39,909 | 41,353 | 41,636 | 46,018 |
| 2005 | 44,532 | 36,615 | 41,500 | 41,532 | 42,391 | 40,482 | 43,010 | 42,425 | 40,240 | 34,676 | 38,771 | 41,618 |
| 2006 | 39,095 | 33,095 | 37,024 | 43,815 | 45,810 | 41,711 | 43,032 | 40,413 | 39,301 | 36,825 | 35,800 | 40,005 |
| 2007 | 40,278 | 33,582 | 39,936 | 39,033 | 44,324 | 42,357 | 41,861 | 43,689 | 38,882 | 38,369 | 38,761 | 41,217 |
| 2008 | 40,029 | 36,089 | 38,697 | 39,615 | 37,808 | 34,902 | 35,166 | 33,917 | 18,893 | 30,635 | 28,641 | 29,216 |
| 2009 | 29,774 | 24,635 | 27,947 | 24,788 | 28,979 | 28,452 | 28,926 | 28,071 | 26,747 | 22,191 | 24,666 | 26,405 |
| 2010 | 21,326 | 20,016 | 24,630 | 20,193 | 18,200 | 21,061 | 22,933 | 20,827 | 19,813 | 18,725 | 19,407 | 21,895 |
| 2011 | 21,003 | 16,002 | 17,115 | 15,702 | 17,478 | 15,850 | 16,807 | 17,723 | 19,858 | 17,712 | 18,457 | 19,156 |
| 2012 | 17,595 | 15,578 | 16,138 | 15,265 | 16,528 | 14,834 | 15,055 | 16,463 | 15,384 | 17,661 | 19,827 | 18,816 |
| 2013 | 17,694 | 17,233 | 16,612 | 13,918 | 15,436 | 16,218 | 17,707 | 14,763 | 15,334 | 16,996 | 18,419 | 19,064 |
| 2014 | 18,257 | 16,673 | 16,533 | 17,015 | 18,134 | 16,092 | 19,074 | 16,620 | 13,801 | 13,257 | 18,224 | 23,842 |
| 2015 | 20,015 | 18,279 | 19,805 | 19,015 | 17,674 | 17,078 | 18,941 | 19,779 | 19,671 | 20,150 | 21,772 | 22,489 |
| 2016 | 20,956 | 17,381 | 19,461 | 15,020 | 15,783 | 16,054 | 17,432 | 16,393 | 15,833 | 19,090 | 19,370 | 21,341 |
| 2017 | 19,359 | 17,195 | 15,581 | 15,105 | 15,762 | 15,419 | 17,095 | 13,547 | 10,387 | 18,043 | 19,810 | 20,031 |
| 2018 | 18,685 | 13,893 | 18,254 | 16,171 | 15,313 | 15,843 | 18,370 | 15,484 | 16,233 | 20,309 | 20,016 | 19,885 |
| 2019 | 22,240 | 17,699 | 21,030 | 15,311 | 17,448 | 17,536 | 17,070 | 17,011 | 13,847 | 18,551 | 19,574 | 20,306 |
| 2020 | 18,474 | 16,605 | 18,125 | 13,108 | 9,689 | 11,058 | 12,029 | 15,114 | 16,094 | 16,341 | 16,880 | 17,798 |
| 2021 | 17,554 | 9,651 | 13,532 | 15,636 | 17,196 | 16,266 | 15,885 | 16,919 | 15,843 | 16,046 | 17,530 | 21,207 |
| 2022 | 16,831 | 14,996 | 16,918 | 16,459 | 20,283 | 17,572 | 18,028 | 19,009 | 17,784 | 17,069 | 20,578 | 18,533 |
| 2023 | 16,727 | 16,096 | 19,520 | 17,996 | 17,489 | 18,011 | 18,853 | 16,555 | 18,817 | 17,244 | 18,241 | 23,033 |
| 2024 | 19,444 | |||||||||||
| - = No Data Reported; -- = Not Applicable; NA = Not Available; W = Withheld to avoid disclosure of individual company data. |
| Release Date: 3/29/2024 |
| Next Release Date: 4/30/2024 |