|
Download Data (XLS File) |
|
||||||||
|
||||||||
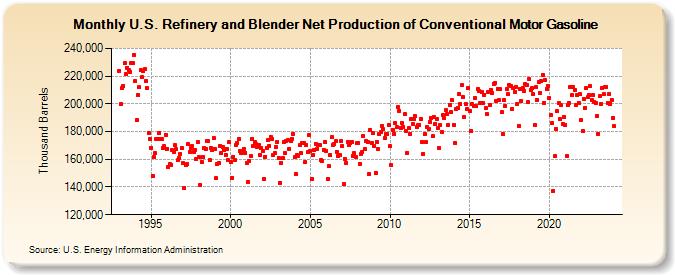
| U.S. Refinery and Blender Net Production of Conventional Motor Gasoline (Thousand Barrels) | ||||||||
| Year | Jan | Feb | Mar | Apr | May | Jun | Jul | Aug | Sep | Oct | Nov | Dec |
|---|---|---|---|---|---|---|---|---|---|---|---|---|
| 1993 | 224,008 | 199,857 | 211,388 | 212,898 | 229,137 | 221,540 | 226,110 | 224,237 | 222,811 | 229,308 | 229,185 | 235,501 |
| 1994 | 216,333 | 188,274 | 206,358 | 211,951 | 224,060 | 219,265 | 223,734 | 225,117 | 216,739 | 211,244 | 179,114 | 174,743 |
| 1995 | 168,331 | 147,964 | 161,554 | 164,245 | 174,324 | 174,356 | 179,294 | 174,714 | 174,698 | 168,340 | 169,263 | 177,817 |
| 1996 | 167,647 | 154,214 | 156,608 | 156,194 | 166,416 | 165,543 | 169,942 | 167,156 | 159,214 | 161,010 | 163,912 | 168,013 |
| 1997 | 157,208 | 139,341 | 155,854 | 156,941 | 170,826 | 165,288 | 168,349 | 169,226 | 165,376 | 166,756 | 160,289 | 172,397 |
| 1998 | 161,591 | 141,497 | 158,325 | 161,773 | 168,073 | 167,170 | 173,012 | 173,516 | 159,504 | 168,063 | 166,425 | 175,153 |
| 1999 | 167,611 | 146,164 | 156,254 | 157,607 | 169,915 | 164,201 | 169,025 | 166,437 | 163,436 | 167,610 | 159,300 | 172,427 |
| 2000 | 158,005 | 146,770 | 161,810 | 159,451 | 170,140 | 171,814 | 174,820 | 165,797 | 164,587 | 165,138 | 167,615 | 164,616 |
| 2001 | 157,633 | 143,700 | 158,504 | 162,666 | 174,913 | 169,601 | 172,396 | 170,659 | 169,089 | 170,122 | 163,195 | 167,827 |
| 2002 | 166,059 | 145,594 | 161,722 | 168,347 | 173,738 | 169,896 | 176,371 | 174,854 | 162,902 | 164,376 | 168,538 | 172,372 |
| 2003 | 161,163 | 143,212 | 157,578 | 160,626 | 172,330 | 164,558 | 173,436 | 173,654 | 167,547 | 173,261 | 174,788 | 177,945 |
| 2004 | 161,405 | 149,327 | 162,887 | 162,175 | 170,091 | 164,238 | 171,815 | 171,917 | 158,008 | 170,390 | 164,888 | 177,165 |
| 2005 | 165,952 | 145,518 | 163,332 | 166,374 | 171,357 | 167,638 | 170,004 | 170,467 | 159,217 | 158,516 | 167,048 | 172,570 |
| 2006 | 165,895 | 145,667 | 154,951 | 163,251 | 175,956 | 170,581 | 170,959 | 173,070 | 165,265 | 162,042 | 162,866 | 173,322 |
| 2007 | 169,632 | 141,857 | 160,303 | 157,504 | 172,619 | 170,102 | 171,680 | 172,766 | 162,600 | 164,461 | 161,956 | 171,469 |
| 2008 | 171,608 | 156,770 | 163,859 | 164,962 | 176,557 | 167,477 | 173,290 | 172,354 | 149,286 | 181,430 | 171,824 | 179,298 |
| 2009 | 169,598 | 150,369 | 172,705 | 167,489 | 178,496 | 179,640 | 184,255 | 181,543 | 175,189 | 178,130 | 177,995 | 184,785 |
| 2010 | 169,264 | 155,647 | 181,306 | 178,475 | 186,099 | 183,302 | 197,797 | 195,040 | 182,815 | 186,296 | 183,223 | 192,398 |
| 2011 | 180,374 | 164,600 | 182,508 | 178,590 | 189,282 | 185,458 | 189,267 | 190,952 | 183,170 | 184,510 | 184,586 | 188,937 |
| 2012 | 172,636 | 163,896 | 178,076 | 172,432 | 183,140 | 181,617 | 187,207 | 189,829 | 176,508 | 190,465 | 185,519 | 188,988 |
| 2013 | 182,888 | 167,957 | 184,522 | 179,809 | 191,647 | 189,861 | 195,313 | 192,511 | 184,773 | 199,330 | 193,950 | 202,505 |
| 2014 | 185,048 | 171,848 | 196,394 | 197,052 | 207,214 | 199,993 | 213,323 | 204,770 | 190,465 | 200,189 | 196,441 | 211,421 |
| 2015 | 195,020 | 180,723 | 199,525 | 198,118 | 204,498 | 198,277 | 210,470 | 209,502 | 200,547 | 208,350 | 200,295 | 206,561 |
| 2016 | 196,963 | 192,607 | 208,884 | 199,133 | 210,277 | 208,015 | 214,461 | 215,281 | 201,830 | 210,877 | 202,644 | 210,518 |
| 2017 | 193,870 | 177,939 | 202,683 | 198,656 | 210,936 | 206,882 | 213,567 | 212,589 | 196,446 | 211,406 | 208,896 | 212,149 |
| 2018 | 200,016 | 184,189 | 211,059 | 201,803 | 211,246 | 209,248 | 214,406 | 213,679 | 200,964 | 217,645 | 210,080 | 211,121 |
| 2019 | 206,803 | 184,461 | 211,904 | 202,825 | 215,474 | 207,897 | 216,249 | 221,081 | 200,929 | 217,086 | 210,740 | 212,836 |
| 2020 | 204,126 | 191,596 | 186,009 | 137,043 | 162,066 | 182,018 | 194,510 | 200,479 | 188,752 | 199,104 | 185,483 | 190,569 |
| 2021 | 184,735 | 162,204 | 198,932 | 200,326 | 212,353 | 206,058 | 212,136 | 209,992 | 199,103 | 206,113 | 200,906 | 207,404 |
| 2022 | 188,253 | 180,539 | 203,803 | 197,229 | 211,214 | 204,719 | 206,143 | 212,520 | 202,540 | 206,389 | 201,341 | 200,840 |
| 2023 | 191,097 | 178,432 | 205,561 | 200,232 | 211,097 | 206,812 | 212,268 | 212,289 | 200,831 | 207,138 | 200,146 | 202,889 |
| 2024 | 189,830 | |||||||||||
| - = No Data Reported; -- = Not Applicable; NA = Not Available; W = Withheld to avoid disclosure of individual company data. |
| Release Date: 3/29/2024 |
| Next Release Date: 4/30/2024 |