|
Download Data (XLS File) |
|
||||||||
|
||||||||
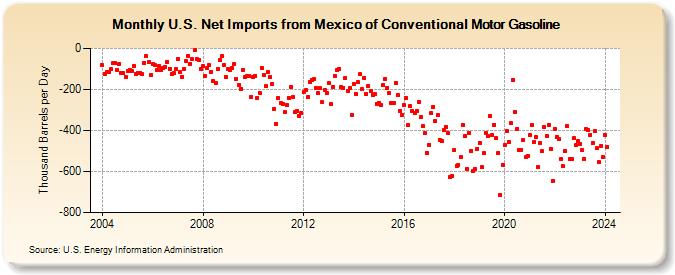
| U.S. Net Imports from Mexico of Conventional Motor Gasoline (Thousand Barrels per Day) | ||||||||
| Year | Jan | Feb | Mar | Apr | May | Jun | Jul | Aug | Sep | Oct | Nov | Dec |
|---|---|---|---|---|---|---|---|---|---|---|---|---|
| 2004 | -81 | -123 | -117 | -114 | -102 | -73 | -71 | -104 | -75 | -121 | -120 | -141 |
| 2005 | -110 | -106 | -111 | -88 | -124 | -118 | -119 | -125 | -69 | -39 | -68 | -130 |
| 2006 | -75 | -83 | -106 | -85 | -106 | -94 | -90 | -65 | -98 | -125 | -122 | -101 |
| 2007 | -50 | -114 | -137 | -101 | -62 | -35 | -74 | -53 | -9 | -54 | -55 | -102 |
| 2008 | -86 | -134 | -97 | -83 | -116 | -161 | -167 | -102 | -56 | -38 | -80 | -140 |
| 2009 | -101 | -103 | -96 | -78 | -147 | -179 | -196 | -104 | -140 | -136 | -134 | -236 |
| 2010 | -140 | -133 | -241 | -215 | -94 | -129 | -185 | -116 | -139 | -172 | -294 | -368 |
| 2011 | -242 | -264 | -273 | -310 | -276 | -240 | -187 | -239 | -312 | -304 | -331 | -314 |
| 2012 | -213 | -203 | -239 | -162 | -155 | -151 | -195 | -217 | -195 | -263 | -202 | -219 |
| 2013 | -170 | -271 | -188 | -133 | -107 | -99 | -187 | -191 | -143 | -206 | -195 | -324 |
| 2014 | -172 | -220 | -166 | -127 | -200 | -142 | -222 | -183 | -208 | -226 | -224 | -270 |
| 2015 | -264 | -276 | -179 | -147 | -192 | -218 | -265 | -265 | -168 | -229 | -303 | -323 |
| 2016 | -276 | -240 | -371 | -280 | -304 | -314 | -304 | -260 | -332 | -380 | -414 | -508 |
| 2017 | -469 | -314 | -284 | -352 | -324 | -444 | -453 | -400 | -384 | -414 | -629 | -622 |
| 2018 | -496 | -572 | -568 | -530 | -373 | -429 | -587 | -410 | -498 | -598 | -587 | -489 |
| 2019 | -461 | -580 | -511 | -413 | -425 | -330 | -423 | -372 | -439 | -509 | -713 | -568 |
| 2020 | -472 | -401 | -456 | -364 | -152 | -308 | -393 | -497 | -495 | -445 | -531 | -523 |
| 2021 | -421 | -373 | -456 | -434 | -577 | -461 | -502 | -382 | -427 | -374 | -488 | -645 |
| 2022 | -392 | -430 | -443 | -538 | -575 | -498 | -379 | -540 | -541 | -437 | -473 | -453 |
| 2023 | -465 | -494 | -539 | -395 | -398 | -422 | -460 | -404 | -487 | -555 | -475 | -529 |
| 2024 | -422 | |||||||||||
| - = No Data Reported; -- = Not Applicable; NA = Not Available; W = Withheld to avoid disclosure of individual company data. |
| Release Date: 3/29/2024 |
| Next Release Date: 4/30/2024 |