|
Download Data (XLS File) |
|
||||||||
|
||||||||
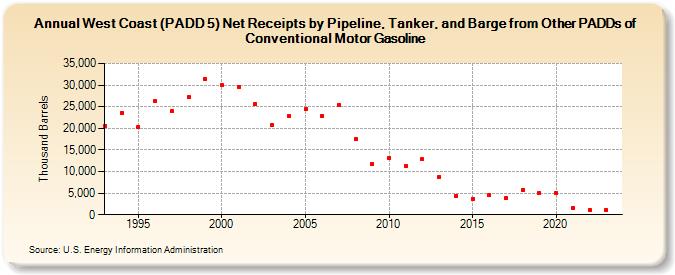
| West Coast (PADD 5) Net Receipts by Pipeline, Tanker, and Barge from Other PADDs of Conventional Motor Gasoline (Thousand Barrels) | ||||||||
| Decade | Year-0 | Year-1 | Year-2 | Year-3 | Year-4 | Year-5 | Year-6 | Year-7 | Year-8 | Year-9 |
|---|---|---|---|---|---|---|---|---|---|---|
| 1990's | 20,619 | 23,639 | 20,340 | 26,207 | 23,982 | 27,150 | 31,384 | |||
| 2000's | 29,944 | 29,611 | 25,649 | 20,803 | 22,808 | 24,442 | 22,908 | 25,442 | 17,495 | 11,719 |
| 2010's | 13,112 | 11,376 | 12,795 | 8,770 | 4,416 | 3,642 | 4,449 | 3,856 | 5,671 | 5,070 |
| 2020's | 5,031 | 1,642 | 1,071 | 1,074 |
| - = No Data Reported; -- = Not Applicable; NA = Not Available; W = Withheld to avoid disclosure of individual company data. |
| Release Date: 3/29/2024 |
| Next Release Date: 8/30/2024 |