|
Download Data (XLS File) |
|
||||||||
|
||||||||
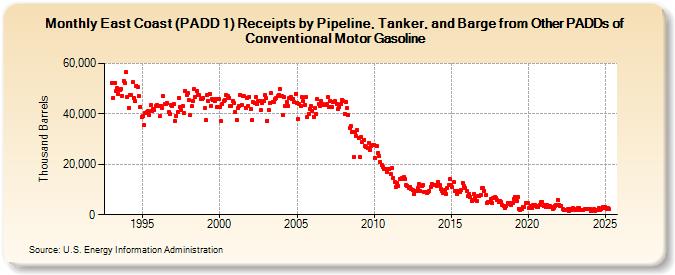
| East Coast (PADD 1) Receipts by Pipeline, Tanker, and Barge from Other PADDs of Conventional Motor Gasoline (Thousand Barrels) | ||||||||
| Year | Jan | Feb | Mar | Apr | May | Jun | Jul | Aug | Sep | Oct | Nov | Dec |
|---|---|---|---|---|---|---|---|---|---|---|---|---|
| 1993 | 52,067 | 46,501 | 52,382 | 49,103 | 50,221 | 47,885 | 49,662 | 50,011 | 47,234 | 53,069 | 52,223 | 56,546 |
| 1994 | 46,796 | 42,364 | 47,551 | 47,449 | 52,455 | 46,345 | 45,016 | 51,165 | 50,705 | 47,063 | 42,864 | 38,724 |
| 1995 | 39,058 | 35,632 | 40,267 | 40,626 | 40,960 | 39,515 | 43,364 | 41,295 | 41,839 | 41,708 | 43,218 | 43,724 |
| 1996 | 42,986 | 39,062 | 43,109 | 42,351 | 46,912 | 43,787 | 43,785 | 44,233 | 40,841 | 39,797 | 43,701 | 43,295 |
| 1997 | 43,918 | 37,179 | 39,215 | 40,653 | 46,320 | 42,777 | 41,443 | 43,003 | 40,418 | 49,243 | 47,599 | 48,094 |
| 1998 | 45,344 | 39,367 | 42,997 | 45,108 | 49,726 | 46,870 | 48,884 | 47,666 | 47,330 | 45,957 | 45,966 | 46,496 |
| 1999 | 42,207 | 37,443 | 47,410 | 44,940 | 48,038 | 43,326 | 46,001 | 45,412 | 45,120 | 46,059 | 42,636 | 45,923 |
| 2000 | 42,861 | 37,055 | 44,106 | 44,982 | 45,699 | 47,481 | 47,027 | 46,435 | 43,079 | 43,141 | 45,231 | 44,506 |
| 2001 | 40,666 | 37,733 | 42,168 | 43,172 | 47,533 | 43,362 | 47,162 | 46,995 | 42,466 | 46,354 | 42,969 | 46,894 |
| 2002 | 41,876 | 37,500 | 44,586 | 44,464 | 46,839 | 43,762 | 45,130 | 45,267 | 41,641 | 44,311 | 45,073 | 47,331 |
| 2003 | 46,137 | 37,343 | 41,584 | 44,323 | 48,216 | 44,810 | 44,630 | 45,849 | 46,394 | 46,957 | 47,579 | 49,849 |
| 2004 | 46,962 | 39,437 | 46,623 | 42,990 | 44,862 | 43,221 | 46,163 | 46,845 | 45,825 | 46,006 | 44,776 | 48,033 |
| 2005 | 44,467 | 37,944 | 43,738 | 43,054 | 46,553 | 44,933 | 43,659 | 46,728 | 38,626 | 39,903 | 42,059 | 43,224 |
| 2006 | 41,342 | 38,941 | 42,403 | 40,017 | 45,845 | 44,113 | 43,244 | 45,083 | 43,761 | 43,538 | 43,390 | 43,785 |
| 2007 | 46,618 | 42,860 | 45,204 | 42,555 | 44,746 | 44,621 | 45,013 | 43,876 | 41,763 | 42,681 | 43,941 | 45,625 |
| 2008 | 45,138 | 40,099 | 44,625 | 42,312 | 39,700 | 34,451 | 35,085 | 32,767 | 22,855 | 32,647 | 31,204 | 33,574 |
| 2009 | 30,597 | 23,077 | 30,869 | 28,671 | 29,593 | 27,256 | 26,795 | 26,596 | 28,564 | 25,792 | 27,069 | 27,665 |
| 2010 | 27,798 | 22,429 | 27,320 | 24,403 | 23,199 | 21,012 | 19,749 | 18,869 | 18,328 | 18,023 | 17,015 | 18,167 |
| 2011 | 18,040 | 15,984 | 18,463 | 14,486 | 12,921 | 11,062 | 12,668 | 11,308 | 14,189 | 14,318 | 14,638 | 14,965 |
| 2012 | 14,295 | 11,722 | 11,588 | 10,631 | 11,193 | 10,081 | 9,704 | 8,278 | 9,399 | 9,301 | 10,665 | 12,238 |
| 2013 | 9,497 | 11,350 | 11,699 | 8,879 | 9,028 | 8,581 | 8,989 | 9,561 | 11,129 | 12,353 | 11,880 | 11,943 |
| 2014 | 11,760 | 11,542 | 12,944 | 11,772 | 10,392 | 9,585 | 8,706 | 9,746 | 8,300 | 10,754 | 11,776 | 14,060 |
| 2015 | 11,757 | 10,910 | 12,831 | 9,437 | 9,438 | 8,368 | 9,231 | 9,136 | 9,710 | 12,745 | 11,233 | 10,656 |
| 2016 | 9,363 | 7,318 | 8,338 | 7,088 | 5,565 | 5,771 | 8,336 | 6,483 | 5,459 | 7,528 | 7,503 | 8,006 |
| 2017 | 10,544 | 10,441 | 9,381 | 7,624 | 4,818 | 5,129 | 5,169 | 6,217 | 4,792 | 6,710 | 6,922 | 6,684 |
| 2018 | 5,701 | 5,212 | 5,637 | 4,942 | 4,034 | 3,418 | 2,731 | 3,587 | 4,595 | 4,208 | 4,815 | 3,853 |
| 2019 | 4,799 | 6,383 | 7,090 | 5,612 | 7,042 | 2,438 | 2,039 | 2,447 | 3,001 | 3,073 | 4,714 | 4,568 |
| 2020 | 4,533 | 2,467 | 3,515 | 2,525 | 3,918 | 3,755 | 3,609 | 3,050 | 2,939 | 4,004 | 5,030 | 5,138 |
| 2021 | 3,295 | 3,940 | 3,172 | 3,780 | 2,897 | 3,275 | 3,211 | 2,437 | 2,678 | 3,370 | 3,826 | 6,017 |
| 2022 | 3,943 | 3,445 | 3,544 | 2,190 | 1,777 | 1,813 | 1,735 | 2,110 | 1,314 | 2,409 | 1,942 | 2,524 |
| 2023 | 2,443 | 2,013 | 1,831 | 2,825 | 2,756 | 2,027 | 1,921 | 1,698 | 2,284 | 2,363 | 2,313 | 2,435 |
| 2024 | 2,366 | |||||||||||
| - = No Data Reported; -- = Not Applicable; NA = Not Available; W = Withheld to avoid disclosure of individual company data. |
| Release Date: 3/29/2024 |
| Next Release Date: 4/30/2024 |