|
Download Data (XLS File) |
|
||||||||
|
||||||||
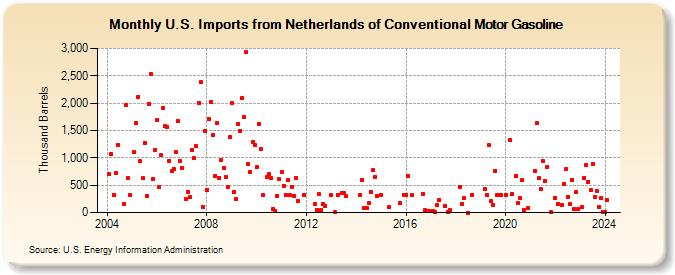
| U.S. Imports from Netherlands of Conventional Motor Gasoline (Thousand Barrels) | ||||||||
| Year | Jan | Feb | Mar | Apr | May | Jun | Jul | Aug | Sep | Oct | Nov | Dec |
|---|---|---|---|---|---|---|---|---|---|---|---|---|
| 2004 | 704 | 1,062 | 330 | 728 | 1,242 | 149 | 1,959 | 634 | 326 | |||
| 2005 | 1,103 | 1,635 | 2,119 | 934 | 623 | 1,278 | 307 | 1,992 | 2,533 | 614 | 1,145 | |
| 2006 | 1,684 | 476 | 1,050 | 1,913 | 1,583 | 1,569 | 939 | 758 | 800 | 1,103 | 1,675 | 949 |
| 2007 | 814 | 251 | 380 | 284 | 1,143 | 991 | 1,212 | 2,002 | 2,377 | 101 | 1,498 | |
| 2008 | 419 | 1,708 | 2,012 | 1,424 | 675 | 1,645 | 634 | 953 | 810 | 646 | 468 | 1,376 |
| 2009 | 1,996 | 368 | 248 | 1,617 | 1,492 | 2,092 | 1,742 | 2,929 | 880 | 743 | 1,295 | 1,236 |
| 2010 | 824 | 1,620 | 1,157 | 320 | 657 | 706 | 628 | 67 | 33 | 308 | 608 | |
| 2011 | 734 | 492 | 326 | 586 | 313 | 476 | 311 | 638 | 219 | 326 | ||
| 2012 | 149 | 53 | 331 | 54 | 149 | 124 | ||||||
| 2013 | 320 | 4 | 329 | 350 | 354 | 311 | ||||||
| 2014 | 327 | 601 | 75 | 90 | 166 | 384 | 770 | 658 | 307 | |||
| 2015 | 321 | 100 | 181 | 329 | ||||||||
| 2016 | 328 | 668 | 314 | 343 | 39 | 37 | ||||||
| 2017 | 23 | 7 | 144 | 225 | 121 | 8 | 39 | |||||
| 2018 | 463 | 162 | 261 | 1 | 324 | |||||||
| 2019 | 423 | 326 | 1,232 | 205 | 135 | 766 | 313 | 321 | 325 | |||
| 2020 | 321 | 1,326 | 331 | 671 | 173 | 274 | 594 | 54 | 78 | |||
| 2021 | 767 | 1,628 | 623 | 427 | 942 | 574 | 838 | 13 | ||||
| 2022 | 265 | 158 | 135 | 520 | 791 | 289 | 158 | 593 | 64 | 379 | 59 | |
| 2023 | 95 | 639 | 865 | 564 | 420 | 896 | 276 | 389 | 108 | 267 | 18 | |
| 2024 | 3 | |||||||||||
| - = No Data Reported; -- = Not Applicable; NA = Not Available; W = Withheld to avoid disclosure of individual company data. |
| Release Date: 3/29/2024 |
| Next Release Date: 4/30/2024 |