|
Download Data (XLS File) |
|
||||||||
|
||||||||
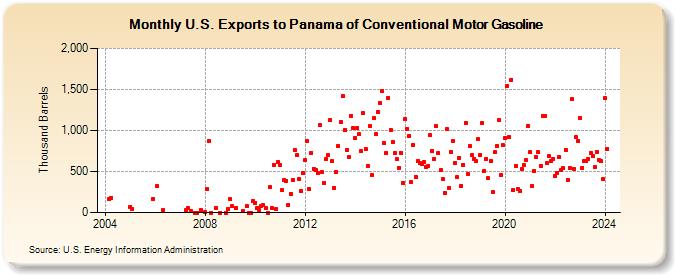
| U.S. Exports to Panama of Conventional Motor Gasoline (Thousand Barrels) | ||||||||
| Year | Jan | Feb | Mar | Apr | May | Jun | Jul | Aug | Sep | Oct | Nov | Dec |
|---|---|---|---|---|---|---|---|---|---|---|---|---|
| 2004 | 162 | 180 | ||||||||||
| 2005 | 68 | 43 | 170 | |||||||||
| 2006 | 318 | 33 | ||||||||||
| 2007 | 30 | 52 | 15 | 0 | 0 | 30 | ||||||
| 2008 | 1 | 284 | 867 | 0 | 61 | 0 | 0 | 42 | ||||
| 2009 | 161 | 79 | 55 | 25 | 74 | 0 | 0 | 138 | ||||
| 2010 | 120 | 60 | 31 | 86 | 90 | 55 | 0 | 310 | 50 | 585 | 40 | 619 |
| 2011 | 577 | 274 | 396 | 387 | 98 | 232 | 394 | 761 | 698 | 407 | 264 | 482 |
| 2012 | 642 | 868 | 285 | 726 | 536 | 515 | 480 | 1,061 | 497 | 365 | 650 | 698 |
| 2013 | 1,128 | 625 | 303 | 492 | 809 | 1,101 | 1,418 | 1,005 | 761 | 676 | 1,178 | 1,028 |
| 2014 | 912 | 1,029 | 951 | 745 | 1,211 | 773 | 573 | 1,058 | 453 | 1,147 | 953 | 1,226 |
| 2015 | 1,336 | 1,475 | 847 | 725 | 1,400 | 1,006 | 860 | 727 | 648 | 546 | 729 | 359 |
| 2016 | 1,134 | 1,022 | 938 | 377 | 824 | 439 | 629 | 602 | 590 | 613 | 558 | 562 |
| 2017 | 939 | 749 | 657 | 1,049 | 724 | 517 | 409 | 241 | 1,018 | 303 | 737 | 870 |
| 2018 | 606 | 430 | 670 | 329 | 585 | 1,092 | 474 | 811 | 697 | 654 | 631 | 896 |
| 2019 | 707 | 1,094 | 511 | 658 | 416 | 632 | 248 | 733 | 807 | 1,129 | 457 | 817 |
| 2020 | 913 | 1,544 | 917 | 1,621 | 276 | 571 | 285 | 264 | 533 | 581 | 639 | 1,055 |
| 2021 | 736 | 322 | 504 | 677 | 734 | 570 | 1,177 | 1,178 | 599 | 684 | 628 | 656 |
| 2022 | 446 | 481 | 674 | 514 | 537 | 766 | 401 | 547 | 1,381 | 534 | 915 | 872 |
| 2023 | 1,152 | 547 | 628 | 626 | 656 | 731 | 689 | 557 | 741 | 645 | 628 | 403 |
| 2024 | 1,395 | |||||||||||
| - = No Data Reported; -- = Not Applicable; NA = Not Available; W = Withheld to avoid disclosure of individual company data. |
| Release Date: 3/29/2024 |
| Next Release Date: 4/30/2024 |