|
Download Data (XLS File) |
|
||||||||
|
||||||||
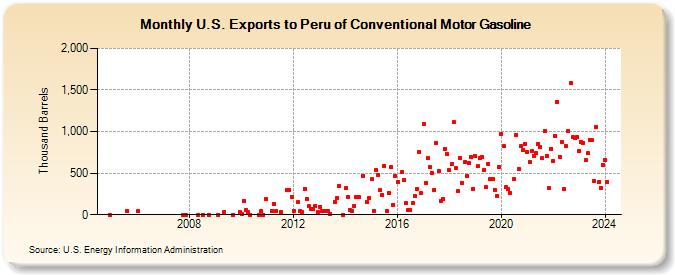
| U.S. Exports to Peru of Conventional Motor Gasoline (Thousand Barrels) | ||||||||
| Year | Jan | Feb | Mar | Apr | May | Jun | Jul | Aug | Sep | Oct | Nov | Dec |
|---|---|---|---|---|---|---|---|---|---|---|---|---|
| 2004 | 0 | |||||||||||
| 2005 | 50 | |||||||||||
| 2006 | 40 | |||||||||||
| 2007 | 0 | 0 | ||||||||||
| 2008 | 0 | 0 | 0 | |||||||||
| 2009 | 0 | 30 | 0 | 30 | ||||||||
| 2010 | 8 | 168 | 55 | 32 | 0 | 0 | 39 | 1 | 187 | |||
| 2011 | 48 | 134 | 48 | 30 | 300 | 295 | 214 | |||||
| 2012 | 50 | 147 | 45 | 35 | 312 | 189 | 99 | 65 | 71 | 108 | 30 | |
| 2013 | 95 | 50 | 40 | 45 | 50 | 7 | 156 | 202 | 347 | 1 | ||
| 2014 | 321 | 219 | 60 | 41 | 105 | 209 | 207 | 469 | 150 | 198 | ||
| 2015 | 424 | 50 | 539 | 476 | 293 | 238 | 591 | 50 | 259 | 570 | 120 | 470 |
| 2016 | 393 | 510 | 421 | 138 | 60 | 58 | 141 | 221 | 313 | 758 | 259 | |
| 2017 | 1,096 | 380 | 677 | 569 | 507 | 303 | 865 | 526 | 170 | 185 | 796 | 728 |
| 2018 | 532 | 613 | 1,110 | 560 | 280 | 682 | 384 | 629 | 463 | 622 | 690 | 312 |
| 2019 | 703 | 580 | 683 | 691 | 536 | 328 | 615 | 425 | 424 | 301 | 226 | 574 |
| 2020 | 976 | 823 | 330 | 315 | 267 | 435 | 961 | 550 | 822 | 778 | 852 | |
| 2021 | 752 | 637 | 766 | 711 | 745 | 854 | 810 | 679 | 1,006 | 710 | 316 | 795 |
| 2022 | 644 | 941 | 1,356 | 697 | 880 | 305 | 828 | 1,009 | 1,584 | 931 | 921 | 935 |
| 2023 | 772 | 874 | 866 | 656 | 738 | 896 | 893 | 406 | 1,053 | 394 | 323 | 601 |
| 2024 | 656 | |||||||||||
| - = No Data Reported; -- = Not Applicable; NA = Not Available; W = Withheld to avoid disclosure of individual company data. |
| Release Date: 3/29/2024 |
| Next Release Date: 4/30/2024 |