|
Download Data (XLS File) |
|
||||||||
|
||||||||
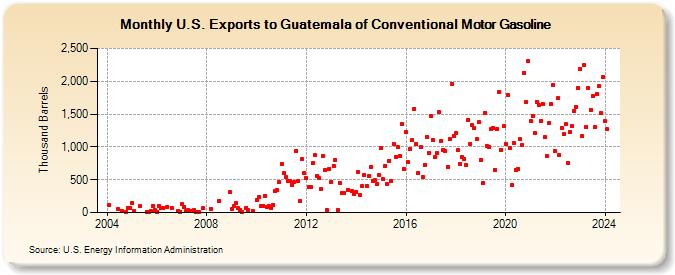
| U.S. Exports to Guatemala of Conventional Motor Gasoline (Thousand Barrels) | ||||||||
| Year | Jan | Feb | Mar | Apr | May | Jun | Jul | Aug | Sep | Oct | Nov | Dec |
|---|---|---|---|---|---|---|---|---|---|---|---|---|
| 2004 | 120 | 50 | 25 | 12 | 67 | 71 | ||||||
| 2005 | 150 | 25 | 95 | 15 | 12 | 20 | 100 | 46 | ||||
| 2006 | 15 | 95 | 74 | 77 | 89 | 75 | 25 | 15 | ||||
| 2007 | 126 | 90 | 31 | 45 | 20 | 19 | 35 | 12 | 9 | 65 | ||
| 2008 | 58 | 182 | 307 | |||||||||
| 2009 | 47 | 94 | 140 | 63 | 41 | 5 | 76 | 32 | 30 | |||
| 2010 | 194 | 231 | 99 | 95 | 258 | 80 | 99 | 64 | 116 | 326 | 336 | 460 |
| 2011 | 743 | 597 | 545 | 480 | 478 | 427 | 458 | 944 | 484 | 171 | 815 | 606 |
| 2012 | 524 | 393 | 396 | 754 | 869 | 561 | 526 | 354 | 863 | 649 | 35 | 669 |
| 2013 | 464 | 713 | 801 | 39 | 455 | 297 | 292 | 349 | 321 | 286 | ||
| 2014 | 313 | 621 | 260 | 399 | 577 | 408 | 555 | 696 | 480 | 489 | 437 | 568 |
| 2015 | 984 | 505 | 708 | 429 | 792 | 487 | 1,048 | 843 | 993 | 864 | 1,355 | 665 |
| 2016 | 1,224 | 766 | 970 | 1,112 | 1,579 | 1,040 | 603 | 992 | 549 | 727 | 1,154 | 900 |
| 2017 | 1,475 | 1,105 | 844 | 901 | 1,525 | 1,089 | 955 | 931 | 698 | 1,115 | 1,964 | 1,169 |
| 2018 | 1,211 | 949 | 744 | 844 | 816 | 723 | 1,413 | 1,051 | 1,326 | 1,285 | 1,113 | 1,376 |
| 2019 | 802 | 457 | 1,522 | 1,015 | 996 | 1,265 | 1,281 | 651 | 1,269 | 1,841 | 954 | 1,321 |
| 2020 | 1,043 | 1,793 | 980 | 421 | 1,058 | 641 | 668 | 1,113 | 1,022 | 2,130 | 1,681 | 2,309 |
| 2021 | 1,394 | 1,475 | 1,207 | 1,686 | 1,644 | 1,392 | 1,648 | 1,145 | 858 | 1,371 | 1,654 | 1,949 |
| 2022 | 932 | 1,737 | 869 | 1,293 | 1,189 | 1,343 | 757 | 1,223 | 1,314 | 1,547 | 1,606 | 1,900 |
| 2023 | 2,186 | 1,161 | 2,250 | 1,308 | 1,896 | 1,561 | 1,779 | 1,298 | 1,801 | 1,934 | 1,514 | 2,070 |
| 2024 | 1,387 | 1,266 | ||||||||||
| - = No Data Reported; -- = Not Applicable; NA = Not Available; W = Withheld to avoid disclosure of individual company data. |
| Release Date: 4/30/2024 |
| Next Release Date: 5/31/2024 |