|
Download Data (XLS File) |
|
||||||||
|
||||||||
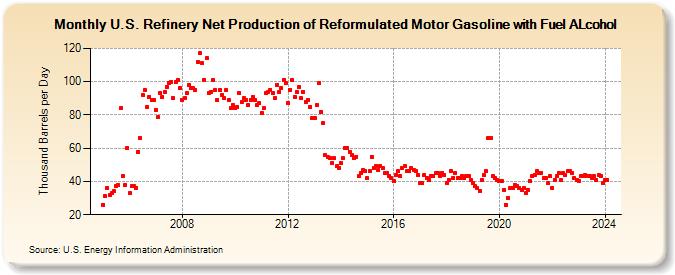
| U.S. Refinery Net Production of Reformulated Motor Gasoline with Fuel ALcohol (Thousand Barrels per Day) | ||||||||
| Year | Jan | Feb | Mar | Apr | May | Jun | Jul | Aug | Sep | Oct | Nov | Dec |
|---|---|---|---|---|---|---|---|---|---|---|---|---|
| 2005 | 26 | 31 | 36 | 32 | 33 | 34 | 37 | 38 | 84 | 43 | 38 | 60 |
| 2006 | 33 | 37 | 37 | 36 | 58 | 66 | 92 | 95 | 85 | 91 | 89 | 89 |
| 2007 | 83 | 79 | 93 | 91 | 94 | 97 | 99 | 100 | 90 | 100 | 101 | 96 |
| 2008 | 89 | 90 | 93 | 98 | 96 | 96 | 95 | 112 | 117 | 111 | 101 | 114 |
| 2009 | 93 | 94 | 101 | 95 | 89 | 95 | 92 | 90 | 95 | 89 | 84 | 86 |
| 2010 | 84 | 85 | 93 | 88 | 90 | 89 | 86 | 89 | 91 | 89 | 86 | 87 |
| 2011 | 81 | 84 | 93 | 94 | 95 | 93 | 90 | 98 | 94 | 96 | 101 | 99 |
| 2012 | 87 | 95 | 101 | 91 | 94 | 97 | 90 | 94 | 88 | 89 | 85 | 78 |
| 2013 | 78 | 86 | 99 | 82 | 75 | 56 | 55 | 54 | 51 | 54 | 49 | 48 |
| 2014 | 51 | 54 | 60 | 60 | 58 | 56 | 54 | 55 | 43 | 45 | 47 | 46 |
| 2015 | 42 | 46 | 55 | 48 | 49 | 47 | 49 | 48 | 45 | 45 | 43 | 42 |
| 2016 | 40 | 44 | 46 | 43 | 48 | 49 | 46 | 46 | 48 | 47 | 46 | 44 |
| 2017 | 39 | 39 | 44 | 42 | 41 | 43 | 43 | 45 | 45 | 43 | 45 | 44 |
| 2018 | 39 | 41 | 46 | 42 | 45 | 42 | 42 | 43 | 42 | 43 | 43 | 41 |
| 2019 | 39 | 37 | 36 | 34 | 41 | 44 | 46 | 66 | 66 | 43 | 42 | 41 |
| 2020 | 40 | 40 | 35 | 26 | 30 | 36 | 36 | 38 | 37 | 36 | 35 | 36 |
| 2021 | 33 | 35 | 40 | 43 | 44 | 46 | 45 | 45 | 42 | 42 | 39 | 43 |
| 2022 | 36 | 41 | 43 | 45 | 41 | 45 | 44 | 46 | 46 | 45 | 42 | 41 |
| 2023 | 40 | 43 | 43 | 44 | 43 | 43 | 42 | 43 | 41 | 44 | 43 | 39 |
| 2024 | 41 | 41 | ||||||||||
| - = No Data Reported; -- = Not Applicable; NA = Not Available; W = Withheld to avoid disclosure of individual company data. |
| Release Date: 4/30/2024 |
| Next Release Date: 5/31/2024 |