|
Download Data (XLS File) |
|
||||||||
|
||||||||
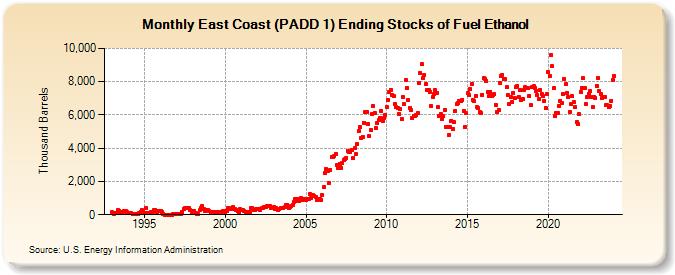
| East Coast (PADD 1) Ending Stocks of Fuel Ethanol (Thousand Barrels) | ||||||||
| Year | Jan | Feb | Mar | Apr | May | Jun | Jul | Aug | Sep | Oct | Nov | Dec |
|---|---|---|---|---|---|---|---|---|---|---|---|---|
| 1993 | 140 | 71 | 113 | 81 | 263 | 240 | 188 | 169 | 164 | 226 | 241 | 162 |
| 1994 | 87 | 79 | 90 | 42 | 66 | 65 | 61 | 53 | 133 | 184 | 273 | 235 |
| 1995 | 125 | 409 | 106 | 108 | 88 | 148 | 174 | 312 | 272 | 154 | 212 | 237 |
| 1996 | 194 | 172 | 34 | 7 | 7 | 7 | 9 | 8 | 8 | 23 | 16 | 27 |
| 1997 | 19 | 22 | 30 | 38 | 174 | 368 | 393 | 421 | 386 | 377 | 255 | 142 |
| 1998 | 249 | 226 | 102 | 42 | 42 | 256 | 422 | 515 | 318 | 225 | 296 | 262 |
| 1999 | 216 | 170 | 161 | 160 | 160 | 160 | 161 | 161 | 153 | 177 | 211 | 241 |
| 2000 | 176 | 218 | 390 | 387 | 336 | 326 | 439 | 349 | 312 | 233 | 147 | 334 |
| 2001 | 289 | 285 | 205 | 175 | 151 | 130 | 169 | 410 | 398 | 281 | 288 | 357 |
| 2002 | 322 | 340 | 308 | 390 | 430 | 490 | 487 | 500 | 508 | 505 | 427 | 385 |
| 2003 | 437 | 363 | 385 | 294 | 359 | 413 | 430 | 426 | 442 | 578 | 612 | 412 |
| 2004 | 458 | 551 | 602 | 778 | 951 | 803 | 967 | 828 | 1,016 | 881 | 974 | 946 |
| 2005 | 902 | 959 | 933 | 1,258 | 1,031 | 1,161 | 1,131 | 1,053 | 909 | 953 | 929 | 897 |
| 2006 | 1,180 | 1,658 | 2,494 | 2,761 | 2,651 | 1,915 | 2,708 | 3,483 | 3,472 | 3,503 | 3,651 | 2,980 |
| 2007 | 2,824 | 3,075 | 2,835 | 3,096 | 3,298 | 3,341 | 3,413 | 3,845 | 3,763 | 3,786 | 3,874 | 3,402 |
| 2008 | 3,995 | 3,632 | 4,247 | 5,042 | 5,271 | 4,615 | 4,660 | 5,542 | 6,181 | 6,191 | 5,470 | 4,731 |
| 2009 | 5,064 | 6,072 | 6,529 | 6,120 | 5,218 | 5,512 | 5,681 | 5,843 | 6,228 | 5,644 | 5,816 | 5,992 |
| 2010 | 6,455 | 6,901 | 7,393 | 7,520 | 7,217 | 7,118 | 6,648 | 6,448 | 6,445 | 6,079 | 6,367 | 5,726 |
| 2011 | 7,079 | 6,635 | 8,085 | 7,634 | 6,874 | 6,438 | 6,269 | 5,817 | 5,910 | 5,958 | 6,016 | 6,097 |
| 2012 | 7,928 | 8,513 | 9,043 | 8,199 | 8,398 | 7,852 | 7,479 | 7,497 | 7,399 | 6,528 | 7,092 | 7,232 |
| 2013 | 7,480 | 7,335 | 6,447 | 5,933 | 6,051 | 5,769 | 5,911 | 6,294 | 5,300 | 5,260 | 4,811 | 5,247 |
| 2014 | 5,654 | 5,127 | 5,545 | 6,249 | 6,642 | 6,746 | 6,820 | 6,846 | 6,915 | 6,239 | 5,289 | 6,086 |
| 2015 | 7,288 | 7,171 | 7,555 | 7,863 | 6,898 | 6,834 | 7,141 | 6,451 | 6,402 | 6,179 | 6,107 | 7,218 |
| 2016 | 8,196 | 8,138 | 8,056 | 7,381 | 7,128 | 7,389 | 7,153 | 7,225 | 7,236 | 6,592 | 6,191 | 6,297 |
| 2017 | 7,924 | 8,321 | 8,411 | 8,138 | 8,136 | 7,649 | 7,185 | 6,675 | 7,079 | 6,762 | 7,345 | 7,014 |
| 2018 | 7,655 | 7,751 | 7,083 | 7,510 | 6,886 | 6,979 | 7,528 | 7,672 | 7,646 | 7,589 | 7,150 | 6,581 |
| 2019 | 7,667 | 7,717 | 7,638 | 7,461 | 7,186 | 6,956 | 7,519 | 7,264 | 7,144 | 6,851 | 6,423 | 7,263 |
| 2020 | 8,557 | 8,352 | 9,591 | 8,916 | 7,601 | 5,907 | 6,103 | 6,107 | 6,529 | 6,857 | 6,739 | 7,272 |
| 2021 | 8,166 | 7,845 | 7,334 | 7,062 | 6,180 | 6,643 | 7,119 | 6,773 | 6,459 | 5,565 | 5,452 | 6,027 |
| 2022 | 7,401 | 7,638 | 8,211 | 7,632 | 6,685 | 7,096 | 7,273 | 7,435 | 7,077 | 6,468 | 7,103 | 7,034 |
| 2023 | 7,768 | 8,230 | 7,452 | 7,287 | 7,035 | 7,079 | 7,100 | 6,577 | 6,572 | 6,451 | 6,542 | 6,864 |
| 2024 | 8,123 | |||||||||||
| - = No Data Reported; -- = Not Applicable; NA = Not Available; W = Withheld to avoid disclosure of individual company data. |
| Release Date: 3/29/2024 |
| Next Release Date: 4/30/2024 |