|
Download Data (XLS File) |
|
||||||||
|
||||||||
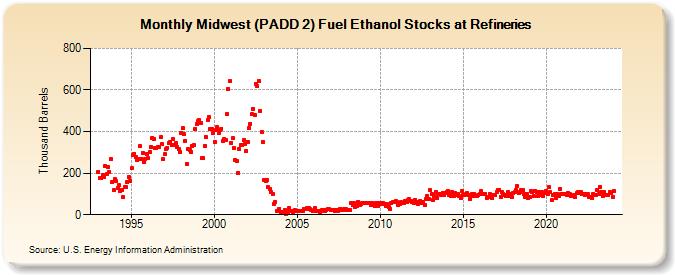
| Midwest (PADD 2) Fuel Ethanol Stocks at Refineries (Thousand Barrels) | ||||||||
| Year | Jan | Feb | Mar | Apr | May | Jun | Jul | Aug | Sep | Oct | Nov | Dec |
|---|---|---|---|---|---|---|---|---|---|---|---|---|
| 1993 | 207 | 178 | 177 | 192 | 182 | 234 | 194 | 231 | 205 | 269 | 159 | 118 |
| 1994 | 170 | 160 | 130 | 141 | 116 | 119 | 83 | 131 | 135 | 156 | 181 | 164 |
| 1995 | 223 | 285 | 294 | 277 | 265 | 266 | 330 | 270 | 297 | 254 | 267 | 294 |
| 1996 | 272 | 302 | 325 | 370 | 364 | 323 | 322 | 325 | 327 | 373 | 338 | 266 |
| 1997 | 291 | 315 | 321 | 343 | 352 | 333 | 365 | 335 | 343 | 326 | 316 | 302 |
| 1998 | 395 | 415 | 386 | 354 | 245 | 315 | 313 | 303 | 329 | 334 | 413 | 436 |
| 1999 | 450 | 454 | 441 | 272 | 271 | 332 | 372 | 456 | 469 | 410 | 414 | 391 |
| 2000 | 352 | 408 | 420 | 392 | 408 | 414 | 355 | 364 | 361 | 483 | 605 | 643 |
| 2001 | 347 | 367 | 321 | 262 | 259 | 203 | 316 | 333 | 334 | 358 | 341 | 305 |
| 2002 | 352 | 416 | 438 | 483 | 510 | 480 | 631 | 619 | 642 | 499 | 398 | 350 |
| 2003 | 168 | 162 | 165 | 133 | 126 | 109 | 98 | 51 | 61 | 19 | 17 | 29 |
| 2004 | 15 | 15 | 12 | 22 | 4 | 14 | 30 | 20 | 17 | 13 | 22 | 16 |
| 2005 | 20 | 19 | 19 | 17 | 18 | 27 | 26 | 31 | 30 | 26 | 21 | 19 |
| 2006 | 17 | 30 | 20 | 17 | 13 | 19 | 21 | 23 | 19 | 22 | 28 | 26 |
| 2007 | 25 | 21 | 22 | 17 | 21 | 17 | 23 | 29 | 23 | 21 | 27 | 26 |
| 2008 | 23 | 24 | 21 | 58 | 45 | 54 | 39 | 44 | 63 | 47 | 50 | 57 |
| 2009 | 56 | 57 | 58 | 54 | 55 | 47 | 56 | 48 | 40 | 57 | 44 | 57 |
| 2010 | 57 | 53 | 57 | 52 | 44 | 50 | 37 | 29 | 56 | 61 | 59 | 64 |
| 2011 | 63 | 47 | 52 | 59 | 54 | 58 | 68 | 60 | 70 | 74 | 65 | 59 |
| 2012 | 55 | 73 | 62 | 53 | 60 | 65 | 58 | 60 | 46 | 76 | 92 | 75 |
| 2013 | 117 | 100 | 73 | 89 | 111 | 79 | 100 | 102 | 96 | 106 | 93 | 106 |
| 2014 | 111 | 112 | 97 | 91 | 107 | 88 | 105 | 97 | 101 | 89 | 78 | 114 |
| 2015 | 93 | 97 | 98 | 103 | 97 | 77 | 99 | 89 | 100 | 88 | 88 | 94 |
| 2016 | 100 | 114 | 100 | 101 | 99 | 82 | 86 | 100 | 90 | 78 | 97 | 94 |
| 2017 | 110 | 119 | 119 | 87 | 107 | 100 | 93 | 91 | 108 | 91 | 98 | 86 |
| 2018 | 106 | 107 | 120 | 137 | 104 | 110 | 120 | 117 | 99 | 87 | 99 | 81 |
| 2019 | 85 | 113 | 108 | 88 | 116 | 109 | 90 | 108 | 97 | 107 | 90 | 106 |
| 2020 | 116 | 98 | 133 | 107 | 70 | 94 | 100 | 78 | 102 | 91 | 126 | 100 |
| 2021 | 100 | 99 | 98 | 93 | 105 | 98 | 91 | 89 | 94 | 86 | 104 | 107 |
| 2022 | 103 | 107 | 99 | 99 | 96 | 100 | 100 | 83 | 87 | 79 | 102 | 94 |
| 2023 | 93 | 117 | 99 | 132 | 108 | 90 | 107 | 96 | 95 | 93 | 109 | 106 |
| 2024 | 87 | |||||||||||
| - = No Data Reported; -- = Not Applicable; NA = Not Available; W = Withheld to avoid disclosure of individual company data. |
| Release Date: 3/29/2024 |
| Next Release Date: 4/30/2024 |