|
Download Data (XLS File) |
|
||||||||
|
||||||||
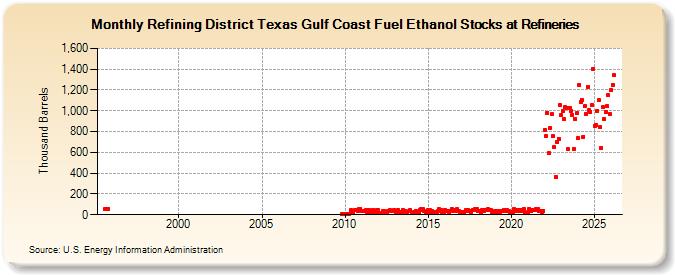
| Refining District Texas Gulf Coast Fuel Ethanol Stocks at Refineries (Thousand Barrels) | ||||||||
| Year | Jan | Feb | Mar | Apr | May | Jun | Jul | Aug | Sep | Oct | Nov | Dec |
|---|---|---|---|---|---|---|---|---|---|---|---|---|
| 1995 | 59 | 59 | 59 | |||||||||
| 2009 | 8 | 7 | ||||||||||
| 2010 | 7 | 6 | 7 | 8 | 41 | 12 | 18 | 45 | 50 | 38 | 54 | 57 |
| 2011 | 39 | 33 | 32 | 44 | 22 | 46 | 14 | 27 | 45 | 17 | 13 | 49 |
| 2012 | 42 | 13 | 14 | 34 | 37 | 30 | 27 | 39 | 42 | 35 | 35 | 41 |
| 2013 | 40 | 24 | 44 | 19 | 24 | 23 | 42 | 33 | 27 | 27 | 33 | 42 |
| 2014 | 19 | 17 | 25 | 31 | 14 | 17 | 46 | 53 | 52 | 32 | 21 | 30 |
| 2015 | 44 | 42 | 21 | 33 | 24 | 14 | 28 | 32 | 52 | 48 | 28 | 24 |
| 2016 | 50 | 32 | 40 | 28 | 37 | 51 | 39 | 47 | 36 | 52 | 38 | 28 |
| 2017 | 20 | 22 | 30 | 45 | 37 | 45 | 36 | 29 | 48 | 43 | 53 | 51 |
| 2018 | 37 | 35 | 21 | 43 | 38 | 50 | 42 | 52 | 47 | 43 | 22 | 20 |
| 2019 | 35 | 31 | 20 | 31 | 25 | 39 | 38 | 49 | 38 | 45 | 31 | 27 |
| 2020 | 25 | 18 | 56 | 48 | 36 | 41 | 32 | 50 | 38 | 56 | 13 | 14 |
| 2021 | 22 | 53 | 37 | 48 | 43 | 49 | 57 | 51 | 38 | 36 | 29 | 36 |
| 2022 | 818 | 755 | 982 | 590 | 836 | 965 | 757 | 648 | 365 | 697 | 733 | 1,055 |
| 2023 | 955 | 1,000 | 917 | 1,036 | 1,028 | 629 | 1,024 | 1,002 | 959 | 630 | 922 | 977 |
| 2024 | 735 | 1,248 | 1,082 | 1,108 | 751 | 1,043 | ||||||
| - = No Data Reported; -- = Not Applicable; NA = Not Available; W = Withheld to avoid disclosure of individual company data. |
| Release Date: 8/30/2024 |
| Next Release Date: 9/30/2024 |
Referring Pages: