|
Download Data (XLS File) |
|
||||||||
|
||||||||
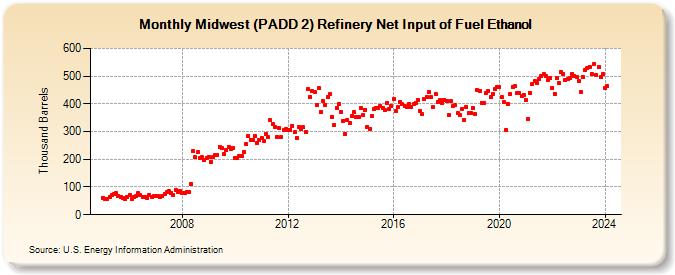
| Midwest (PADD 2) Refinery Net Input of Fuel Ethanol (Thousand Barrels) | ||||||||
| Year | Jan | Feb | Mar | Apr | May | Jun | Jul | Aug | Sep | Oct | Nov | Dec |
|---|---|---|---|---|---|---|---|---|---|---|---|---|
| 2005 | 61 | 57 | 58 | 64 | 72 | 74 | 77 | 67 | 65 | 61 | 58 | 63 |
| 2006 | 70 | 57 | 63 | 67 | 77 | 70 | 65 | 65 | 61 | 72 | 65 | 67 |
| 2007 | 67 | 66 | 65 | 68 | 76 | 81 | 84 | 79 | 72 | 89 | 82 | 84 |
| 2008 | 78 | 79 | 82 | 82 | 112 | 230 | 208 | 226 | 206 | 207 | 198 | 206 |
| 2009 | 210 | 191 | 207 | 216 | 216 | 245 | 239 | 219 | 232 | 244 | 237 | 242 |
| 2010 | 206 | 204 | 211 | 211 | 228 | 254 | 285 | 271 | 270 | 285 | 258 | 269 |
| 2011 | 275 | 266 | 291 | 280 | 340 | 327 | 318 | 280 | 312 | 279 | 306 | 309 |
| 2012 | 305 | 307 | 321 | 297 | 278 | 318 | 309 | 315 | 299 | 454 | 425 | 447 |
| 2013 | 443 | 396 | 456 | 372 | 409 | 395 | 423 | 434 | 354 | 323 | 385 | 400 |
| 2014 | 371 | 339 | 290 | 340 | 330 | 355 | 369 | 354 | 351 | 385 | 359 | 379 |
| 2015 | 316 | 311 | 356 | 380 | 386 | 386 | 393 | 384 | 376 | 403 | 381 | 392 |
| 2016 | 418 | 373 | 388 | 408 | 398 | 392 | 388 | 400 | 390 | 398 | 404 | 415 |
| 2017 | 375 | 362 | 417 | 424 | 443 | 424 | 389 | 437 | 405 | 414 | 403 | 414 |
| 2018 | 411 | 358 | 411 | 393 | 394 | 367 | 361 | 382 | 343 | 390 | 366 | 367 |
| 2019 | 385 | 363 | 449 | 448 | 404 | 403 | 438 | 446 | 423 | 437 | 453 | 462 |
| 2020 | 459 | 424 | 407 | 305 | 401 | 436 | 462 | 464 | 438 | 439 | 429 | 433 |
| 2021 | 413 | 345 | 440 | 472 | 481 | 475 | 490 | 502 | 507 | 501 | 486 | 493 |
| 2022 | 458 | 437 | 492 | 475 | 515 | 508 | 487 | 488 | 494 | 507 | 502 | 498 |
| 2023 | 482 | 444 | 497 | 523 | 531 | 534 | 507 | 544 | 504 | 534 | 496 | 506 |
| 2024 | 456 | |||||||||||
| - = No Data Reported; -- = Not Applicable; NA = Not Available; W = Withheld to avoid disclosure of individual company data. |
| Release Date: 3/29/2024 |
| Next Release Date: 4/30/2024 |
Referring Pages: