|
Download Data (XLS File) |
|
||||||||
|
||||||||
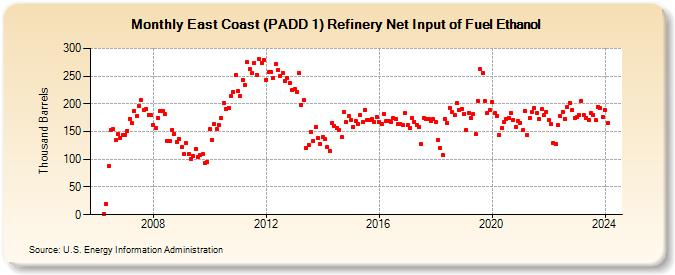
| East Coast (PADD 1) Refinery Net Input of Fuel Ethanol (Thousand Barrels) | ||||||||
| Year | Jan | Feb | Mar | Apr | May | Jun | Jul | Aug | Sep | Oct | Nov | Dec |
|---|---|---|---|---|---|---|---|---|---|---|---|---|
| 2006 | 2 | 20 | 87 | 152 | 154 | 134 | 146 | 139 | 143 | |||
| 2007 | 144 | 151 | 173 | 165 | 187 | 178 | 196 | 207 | 189 | 190 | 180 | 179 |
| 2008 | 162 | 157 | 174 | 187 | 187 | 181 | 133 | 133 | 153 | 146 | 132 | 137 |
| 2009 | 122 | 109 | 129 | 109 | 101 | 106 | 119 | 105 | 107 | 109 | 94 | 95 |
| 2010 | 154 | 135 | 164 | 155 | 162 | 175 | 201 | 191 | 193 | 214 | 221 | 252 |
| 2011 | 223 | 214 | 243 | 234 | 275 | 262 | 255 | 274 | 252 | 281 | 274 | 279 |
| 2012 | 243 | 258 | 258 | 246 | 271 | 261 | 251 | 256 | 241 | 247 | 238 | 225 |
| 2013 | 227 | 222 | 256 | 198 | 207 | 120 | 126 | 150 | 133 | 158 | 139 | 128 |
| 2014 | 140 | 137 | 122 | 115 | 166 | 160 | 156 | 152 | 140 | 186 | 167 | 178 |
| 2015 | 171 | 159 | 169 | 164 | 180 | 167 | 189 | 170 | 171 | 173 | 167 | 176 |
| 2016 | 167 | 163 | 182 | 169 | 169 | 168 | 174 | 172 | 164 | 164 | 162 | 183 |
| 2017 | 161 | 157 | 174 | 168 | 161 | 159 | 127 | 175 | 172 | 173 | 169 | 173 |
| 2018 | 168 | 135 | 120 | 108 | 173 | 165 | 193 | 186 | 179 | 201 | 189 | 191 |
| 2019 | 182 | 153 | 184 | 174 | 181 | 145 | 206 | 263 | 256 | 206 | 183 | 189 |
| 2020 | 203 | 183 | 178 | 144 | 156 | 167 | 172 | 175 | 184 | 171 | 158 | 169 |
| 2021 | 166 | 152 | 187 | 144 | 174 | 186 | 192 | 184 | 173 | 191 | 179 | 186 |
| 2022 | 170 | 163 | 130 | 128 | 162 | 178 | 186 | 173 | 195 | 202 | 188 | 175 |
| 2023 | 176 | 180 | 206 | 180 | 174 | 170 | 183 | 180 | 171 | 195 | 192 | 177 |
| 2024 | 189 | |||||||||||
| - = No Data Reported; -- = Not Applicable; NA = Not Available; W = Withheld to avoid disclosure of individual company data. |
| Release Date: 3/29/2024 |
| Next Release Date: 4/30/2024 |
Referring Pages: