|
Download Data (XLS File) |
|
||||||||
|
||||||||
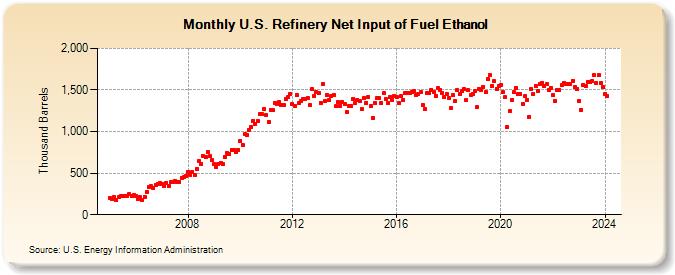
| U.S. Refinery Net Input of Fuel Ethanol (Thousand Barrels) | ||||||||
| Year | Jan | Feb | Mar | Apr | May | Jun | Jul | Aug | Sep | Oct | Nov | Dec |
|---|---|---|---|---|---|---|---|---|---|---|---|---|
| 2005 | 199 | 192 | 207 | 179 | 209 | 221 | 229 | 229 | 226 | 246 | 225 | 241 |
| 2006 | 225 | 192 | 208 | 181 | 218 | 274 | 332 | 340 | 318 | 358 | 369 | 382 |
| 2007 | 367 | 345 | 387 | 351 | 393 | 393 | 410 | 392 | 392 | 445 | 450 | 468 |
| 2008 | 517 | 481 | 516 | 482 | 552 | 645 | 613 | 705 | 693 | 752 | 702 | 654 |
| 2009 | 604 | 568 | 611 | 619 | 604 | 700 | 748 | 729 | 777 | 781 | 756 | 781 |
| 2010 | 891 | 844 | 965 | 964 | 1,020 | 1,057 | 1,131 | 1,089 | 1,128 | 1,212 | 1,208 | 1,267 |
| 2011 | 1,195 | 1,118 | 1,264 | 1,255 | 1,345 | 1,329 | 1,355 | 1,322 | 1,315 | 1,392 | 1,413 | 1,456 |
| 2012 | 1,326 | 1,311 | 1,438 | 1,347 | 1,369 | 1,397 | 1,394 | 1,408 | 1,318 | 1,511 | 1,428 | 1,475 |
| 2013 | 1,460 | 1,344 | 1,577 | 1,362 | 1,444 | 1,376 | 1,429 | 1,445 | 1,302 | 1,357 | 1,311 | 1,353 |
| 2014 | 1,326 | 1,233 | 1,304 | 1,307 | 1,391 | 1,349 | 1,382 | 1,363 | 1,269 | 1,401 | 1,346 | 1,418 |
| 2015 | 1,306 | 1,164 | 1,341 | 1,398 | 1,398 | 1,341 | 1,460 | 1,390 | 1,346 | 1,421 | 1,379 | 1,424 |
| 2016 | 1,412 | 1,338 | 1,422 | 1,379 | 1,466 | 1,458 | 1,467 | 1,471 | 1,489 | 1,443 | 1,453 | 1,471 |
| 2017 | 1,319 | 1,266 | 1,464 | 1,462 | 1,505 | 1,480 | 1,433 | 1,518 | 1,504 | 1,464 | 1,418 | 1,454 |
| 2018 | 1,409 | 1,281 | 1,439 | 1,362 | 1,494 | 1,449 | 1,484 | 1,512 | 1,383 | 1,495 | 1,444 | 1,456 |
| 2019 | 1,482 | 1,294 | 1,517 | 1,505 | 1,540 | 1,470 | 1,628 | 1,684 | 1,552 | 1,603 | 1,515 | 1,545 |
| 2020 | 1,558 | 1,471 | 1,411 | 1,054 | 1,242 | 1,383 | 1,470 | 1,529 | 1,454 | 1,449 | 1,337 | 1,422 |
| 2021 | 1,382 | 1,180 | 1,508 | 1,455 | 1,552 | 1,492 | 1,573 | 1,587 | 1,545 | 1,567 | 1,498 | 1,527 |
| 2022 | 1,437 | 1,371 | 1,505 | 1,501 | 1,554 | 1,588 | 1,572 | 1,567 | 1,571 | 1,612 | 1,538 | 1,516 |
| 2023 | 1,368 | 1,264 | 1,565 | 1,545 | 1,600 | 1,591 | 1,609 | 1,676 | 1,579 | 1,681 | 1,584 | 1,538 |
| 2024 | 1,455 | |||||||||||
| - = No Data Reported; -- = Not Applicable; NA = Not Available; W = Withheld to avoid disclosure of individual company data. |
| Release Date: 3/29/2024 |
| Next Release Date: 4/30/2024 |
Referring Pages: