|
Download Data (XLS File) |
|
||||||||
|
||||||||
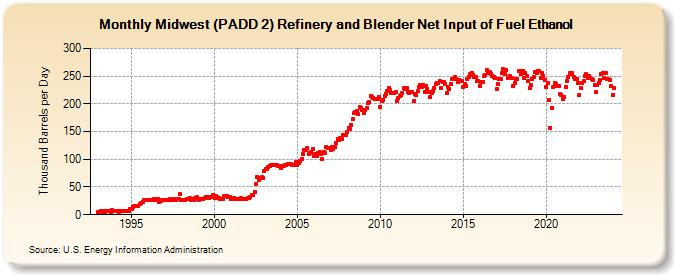
| Midwest (PADD 2) Refinery and Blender Net Input of Fuel Ethanol (Thousand Barrels per Day) | ||||||||
| Year | Jan | Feb | Mar | Apr | May | Jun | Jul | Aug | Sep | Oct | Nov | Dec |
|---|---|---|---|---|---|---|---|---|---|---|---|---|
| 1993 | 5 | 5 | 6 | 5 | 6 | 5 | 7 | 6 | 7 | 4 | 8 | 6 |
| 1994 | 6 | 6 | 7 | 5 | 6 | 6 | 7 | 7 | 7 | 6 | 6 | 11 |
| 1995 | 11 | 14 | 15 | 15 | 15 | 16 | 20 | 21 | 23 | 27 | 27 | 27 |
| 1996 | 27 | 26 | 27 | 27 | 28 | 27 | 29 | 28 | 23 | 25 | 26 | 26 |
| 1997 | 26 | 26 | 26 | 27 | 28 | 27 | 27 | 28 | 27 | 29 | 28 | 37 |
| 1998 | 26 | 27 | 26 | 26 | 29 | 28 | 31 | 27 | 28 | 26 | 31 | 32 |
| 1999 | 28 | 27 | 28 | 29 | 29 | 31 | 32 | 32 | 31 | 32 | 32 | 35 |
| 2000 | 31 | 33 | 32 | 31 | 28 | 29 | 29 | 34 | 33 | 33 | 32 | 32 |
| 2001 | 28 | 29 | 31 | 28 | 28 | 28 | 28 | 30 | 28 | 28 | 28 | 29 |
| 2002 | 30 | 30 | 32 | 35 | 36 | 41 | 55 | 68 | 63 | 66 | 68 | 66 |
| 2003 | 78 | 83 | 83 | 86 | 88 | 90 | 90 | 90 | 90 | 89 | 88 | 87 |
| 2004 | 84 | 87 | 88 | 89 | 89 | 92 | 92 | 91 | 90 | 90 | 90 | 95 |
| 2005 | 90 | 94 | 96 | 100 | 110 | 117 | 117 | 121 | 109 | 112 | 113 | 118 |
| 2006 | 106 | 109 | 106 | 111 | 114 | 110 | 100 | 113 | 111 | 123 | 120 | 121 |
| 2007 | 117 | 122 | 119 | 123 | 129 | 137 | 135 | 138 | 137 | 143 | 144 | 144 |
| 2008 | 149 | 156 | 154 | 161 | 172 | 183 | 185 | 187 | 181 | 194 | 192 | 189 |
| 2009 | 183 | 189 | 192 | 201 | 204 | 214 | 213 | 210 | 209 | 209 | 208 | 212 |
| 2010 | 195 | 205 | 207 | 214 | 218 | 223 | 228 | 225 | 220 | 220 | 219 | 222 |
| 2011 | 206 | 210 | 215 | 216 | 219 | 228 | 226 | 228 | 222 | 220 | 222 | 222 |
| 2012 | 205 | 217 | 216 | 223 | 231 | 234 | 230 | 234 | 222 | 233 | 227 | 221 |
| 2013 | 212 | 219 | 223 | 228 | 236 | 237 | 237 | 241 | 229 | 240 | 239 | 235 |
| 2014 | 220 | 230 | 227 | 236 | 245 | 244 | 248 | 245 | 240 | 243 | 241 | 241 |
| 2015 | 230 | 235 | 233 | 244 | 248 | 253 | 256 | 252 | 248 | 249 | 242 | 241 |
| 2016 | 232 | 240 | 240 | 250 | 252 | 261 | 256 | 258 | 254 | 250 | 249 | 247 |
| 2017 | 227 | 235 | 245 | 245 | 256 | 263 | 253 | 261 | 247 | 249 | 250 | 246 |
| 2018 | 232 | 238 | 245 | 244 | 259 | 259 | 254 | 259 | 246 | 256 | 251 | 242 |
| 2019 | 229 | 234 | 244 | 249 | 257 | 256 | 259 | 260 | 247 | 256 | 251 | 243 |
| 2020 | 231 | 237 | 207 | 157 | 193 | 231 | 238 | 235 | 232 | 232 | 217 | 216 |
| 2021 | 208 | 213 | 230 | 242 | 249 | 255 | 254 | 255 | 248 | 244 | 244 | 238 |
| 2022 | 216 | 229 | 237 | 241 | 250 | 253 | 246 | 251 | 247 | 245 | 243 | 234 |
| 2023 | 221 | 234 | 237 | 243 | 253 | 255 | 246 | 256 | 243 | 245 | 243 | 233 |
| 2024 | 216 | 229 | 233 | 244 | 253 | 250 | ||||||
| - = No Data Reported; -- = Not Applicable; NA = Not Available; W = Withheld to avoid disclosure of individual company data. |
| Release Date: 8/30/2024 |
| Next Release Date: 9/30/2024 |