|
Download Data (XLS File) |
|
||||||||
|
||||||||
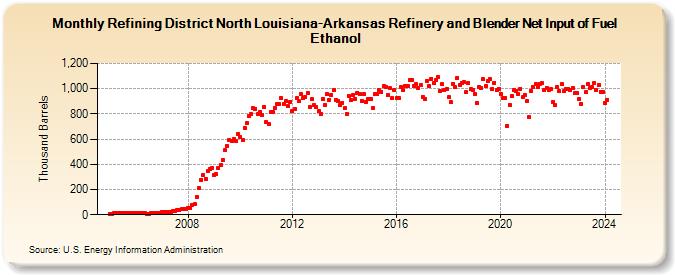
| Refining District North Louisiana-Arkansas Refinery and Blender Net Input of Fuel Ethanol (Thousand Barrels) | ||||||||
| Year | Jan | Feb | Mar | Apr | May | Jun | Jul | Aug | Sep | Oct | Nov | Dec |
|---|---|---|---|---|---|---|---|---|---|---|---|---|
| 2005 | 9 | 9 | 11 | 12 | 13 | 13 | 13 | 14 | 12 | 10 | 10 | 11 |
| 2006 | 12 | 10 | 10 | 10 | 13 | 9 | 9 | 12 | 10 | 11 | 12 | 13 |
| 2007 | 22 | 20 | 23 | 23 | 25 | 26 | 32 | 38 | 39 | 42 | 46 | 47 |
| 2008 | 55 | 56 | 77 | 82 | 142 | 211 | 278 | 317 | 282 | 348 | 364 | 371 |
| 2009 | 312 | 322 | 369 | 398 | 434 | 510 | 545 | 592 | 583 | 600 | 588 | 641 |
| 2010 | 614 | 593 | 691 | 725 | 781 | 801 | 843 | 840 | 799 | 816 | 790 | 855 |
| 2011 | 734 | 723 | 816 | 816 | 847 | 881 | 876 | 927 | 878 | 901 | 861 | 897 |
| 2012 | 820 | 837 | 926 | 900 | 955 | 925 | 933 | 965 | 858 | 916 | 867 | 855 |
| 2013 | 820 | 798 | 918 | 871 | 959 | 913 | 951 | 989 | 911 | 906 | 869 | 890 |
| 2014 | 847 | 803 | 942 | 910 | 948 | 917 | 968 | 961 | 905 | 954 | 896 | 920 |
| 2015 | 916 | 850 | 956 | 957 | 987 | 977 | 1,019 | 1,015 | 948 | 1,002 | 923 | 986 |
| 2016 | 930 | 923 | 1,013 | 986 | 1,021 | 1,020 | 1,065 | 1,070 | 1,021 | 1,034 | 1,007 | 1,026 |
| 2017 | 937 | 922 | 1,061 | 1,021 | 1,079 | 1,045 | 1,065 | 1,095 | 984 | 1,036 | 992 | 1,000 |
| 2018 | 932 | 891 | 1,040 | 1,011 | 1,087 | 1,031 | 1,046 | 1,053 | 971 | 1,043 | 996 | 988 |
| 2019 | 959 | 888 | 1,017 | 1,005 | 1,073 | 1,018 | 1,064 | 1,074 | 999 | 1,048 | 987 | 1,001 |
| 2020 | 961 | 924 | 929 | 702 | 874 | 943 | 991 | 982 | 956 | 1,000 | 931 | 950 |
| 2021 | 900 | 775 | 983 | 1,014 | 1,037 | 1,012 | 1,040 | 1,042 | 989 | 1,009 | 990 | 995 |
| 2022 | 896 | 867 | 1,011 | 978 | 1,036 | 981 | 994 | 999 | 988 | 1,009 | 962 | 966 |
| 2023 | 917 | 879 | 1,011 | 970 | 1,035 | 1,009 | 1,014 | 1,047 | 987 | 1,028 | 976 | 974 |
| 2024 | 885 | |||||||||||
| - = No Data Reported; -- = Not Applicable; NA = Not Available; W = Withheld to avoid disclosure of individual company data. |
| Release Date: 3/29/2024 |
| Next Release Date: 4/30/2024 |