|
Download Data (XLS File) |
|
||||||||
|
||||||||
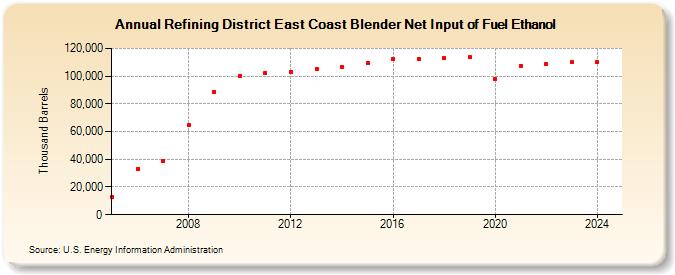
| Refining District East Coast Blender Net Input of Fuel Ethanol (Thousand Barrels) | ||||||||
| Decade | Year-0 | Year-1 | Year-2 | Year-3 | Year-4 | Year-5 | Year-6 | Year-7 | Year-8 | Year-9 |
|---|---|---|---|---|---|---|---|---|---|---|
| 2000's | 12,980 | 33,196 | 39,013 | 64,757 | 88,704 | |||||
| 2010's | 100,228 | 102,096 | 103,181 | 104,950 | 106,603 | 109,443 | 112,160 | 112,569 | 113,067 | 113,479 |
| 2020's | 97,607 | 107,538 | 108,709 | 109,862 |
| - = No Data Reported; -- = Not Applicable; NA = Not Available; W = Withheld to avoid disclosure of individual company data. |
| Release Date: 3/29/2024 |
| Next Release Date: 8/30/2024 |
Referring Pages: