|
Download Data (XLS File) |
|
||||||||
|
||||||||
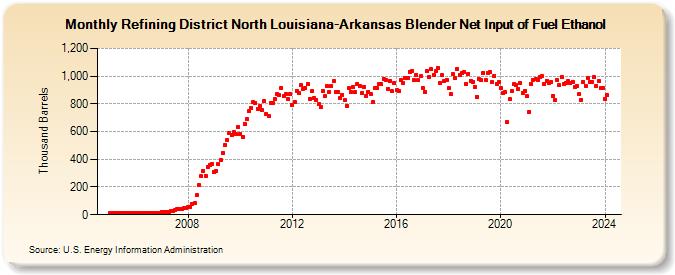
| Refining District North Louisiana-Arkansas Blender Net Input of Fuel Ethanol (Thousand Barrels) | ||||||||
| Year | Jan | Feb | Mar | Apr | May | Jun | Jul | Aug | Sep | Oct | Nov | Dec |
|---|---|---|---|---|---|---|---|---|---|---|---|---|
| 2005 | 9 | 9 | 11 | 12 | 13 | 13 | 13 | 14 | 12 | 10 | 10 | 11 |
| 2006 | 12 | 10 | 10 | 10 | 13 | 9 | 9 | 12 | 10 | 11 | 12 | 13 |
| 2007 | 22 | 20 | 23 | 23 | 25 | 26 | 32 | 38 | 39 | 42 | 46 | 47 |
| 2008 | 55 | 56 | 77 | 82 | 142 | 211 | 278 | 317 | 282 | 346 | 359 | 365 |
| 2009 | 307 | 314 | 363 | 394 | 444 | 505 | 541 | 586 | 576 | 594 | 580 | 633 |
| 2010 | 583 | 563 | 658 | 687 | 746 | 767 | 811 | 807 | 764 | 784 | 756 | 819 |
| 2011 | 726 | 715 | 807 | 806 | 835 | 871 | 865 | 916 | 857 | 872 | 834 | 870 |
| 2012 | 795 | 811 | 896 | 875 | 934 | 908 | 913 | 941 | 837 | 890 | 841 | 827 |
| 2013 | 796 | 774 | 892 | 854 | 930 | 886 | 928 | 963 | 885 | 884 | 845 | 866 |
| 2014 | 826 | 785 | 911 | 887 | 920 | 887 | 943 | 931 | 876 | 925 | 859 | 888 |
| 2015 | 872 | 811 | 912 | 911 | 940 | 941 | 982 | 974 | 910 | 967 | 890 | 951 |
| 2016 | 899 | 889 | 973 | 952 | 988 | 989 | 1,032 | 1,038 | 969 | 1,010 | 969 | 998 |
| 2017 | 911 | 888 | 1,036 | 994 | 1,048 | 1,010 | 1,034 | 1,058 | 951 | 1,005 | 965 | 975 |
| 2018 | 912 | 870 | 1,012 | 986 | 1,052 | 1,005 | 1,019 | 1,028 | 945 | 1,016 | 967 | 960 |
| 2019 | 924 | 849 | 979 | 970 | 1,025 | 975 | 1,025 | 1,030 | 954 | 1,001 | 944 | 954 |
| 2020 | 913 | 878 | 882 | 667 | 832 | 894 | 941 | 933 | 907 | 949 | 880 | 896 |
| 2021 | 854 | 744 | 942 | 972 | 982 | 970 | 993 | 998 | 943 | 965 | 949 | 956 |
| 2022 | 859 | 829 | 970 | 934 | 992 | 942 | 952 | 963 | 950 | 958 | 918 | 926 |
| 2023 | 872 | 831 | 959 | 932 | 985 | 957 | 959 | 990 | 929 | 965 | 915 | 912 |
| 2024 | 834 | |||||||||||
| - = No Data Reported; -- = Not Applicable; NA = Not Available; W = Withheld to avoid disclosure of individual company data. |
| Release Date: 3/29/2024 |
| Next Release Date: 4/30/2024 |