|
Download Data (XLS File) |
|
||||||||
|
||||||||
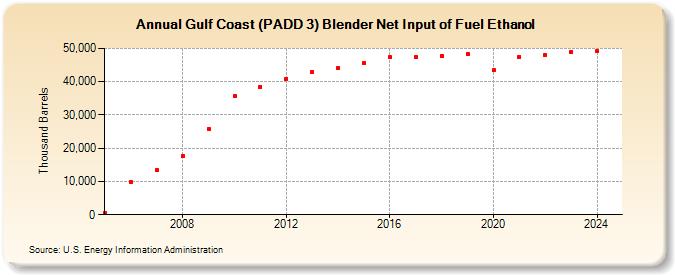
| Gulf Coast (PADD 3) Blender Net Input of Fuel Ethanol (Thousand Barrels) | ||||||||
| Decade | Year-0 | Year-1 | Year-2 | Year-3 | Year-4 | Year-5 | Year-6 | Year-7 | Year-8 | Year-9 |
|---|---|---|---|---|---|---|---|---|---|---|
| 2000's | 545 | 9,893 | 13,349 | 17,626 | 25,898 | |||||
| 2010's | 35,678 | 38,518 | 40,909 | 42,839 | 44,134 | 45,576 | 47,285 | 47,478 | 47,846 | 48,301 |
| 2020's | 43,385 | 47,475 | 47,997 | 48,992 |
| - = No Data Reported; -- = Not Applicable; NA = Not Available; W = Withheld to avoid disclosure of individual company data. |
| Release Date: 4/30/2024 |
| Next Release Date: 8/30/2024 |
Referring Pages: