|
Download Data (XLS File) |
|
||||||||
|
||||||||
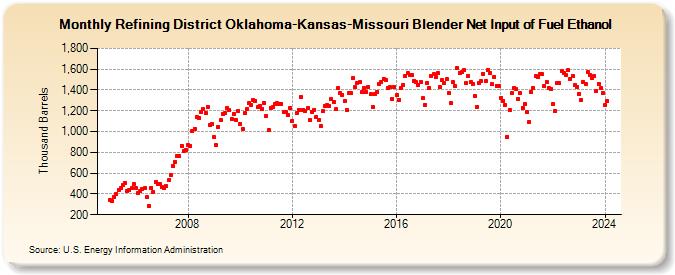
| Refining District Oklahoma-Kansas-Missouri Blender Net Input of Fuel Ethanol (Thousand Barrels) | ||||||||
| Year | Jan | Feb | Mar | Apr | May | Jun | Jul | Aug | Sep | Oct | Nov | Dec |
|---|---|---|---|---|---|---|---|---|---|---|---|---|
| 2005 | 340 | 328 | 372 | 401 | 439 | 456 | 482 | 508 | 427 | 436 | 453 | 497 |
| 2006 | 457 | 412 | 429 | 444 | 455 | 368 | 283 | 460 | 418 | 515 | 493 | 492 |
| 2007 | 465 | 454 | 474 | 530 | 583 | 670 | 708 | 765 | 762 | 864 | 811 | 823 |
| 2008 | 872 | 862 | 1,009 | 1,028 | 1,136 | 1,134 | 1,185 | 1,214 | 1,179 | 1,238 | 1,061 | 1,068 |
| 2009 | 945 | 868 | 1,046 | 1,109 | 1,172 | 1,174 | 1,228 | 1,203 | 1,123 | 1,172 | 1,112 | 1,202 |
| 2010 | 1,077 | 1,025 | 1,175 | 1,216 | 1,270 | 1,258 | 1,306 | 1,295 | 1,232 | 1,249 | 1,218 | 1,278 |
| 2011 | 1,147 | 1,012 | 1,228 | 1,238 | 1,265 | 1,271 | 1,265 | 1,267 | 1,184 | 1,185 | 1,163 | 1,225 |
| 2012 | 1,104 | 1,053 | 1,175 | 1,211 | 1,331 | 1,211 | 1,197 | 1,222 | 1,112 | 1,188 | 1,211 | 1,141 |
| 2013 | 1,115 | 1,053 | 1,194 | 1,249 | 1,255 | 1,248 | 1,310 | 1,284 | 1,213 | 1,418 | 1,372 | 1,356 |
| 2014 | 1,290 | 1,212 | 1,371 | 1,370 | 1,515 | 1,426 | 1,470 | 1,476 | 1,378 | 1,417 | 1,384 | 1,427 |
| 2015 | 1,357 | 1,238 | 1,363 | 1,385 | 1,457 | 1,474 | 1,507 | 1,500 | 1,421 | 1,426 | 1,312 | 1,426 |
| 2016 | 1,348 | 1,307 | 1,421 | 1,451 | 1,537 | 1,562 | 1,548 | 1,547 | 1,491 | 1,475 | 1,445 | 1,476 |
| 2017 | 1,318 | 1,260 | 1,470 | 1,419 | 1,539 | 1,551 | 1,529 | 1,565 | 1,424 | 1,497 | 1,463 | 1,501 |
| 2018 | 1,374 | 1,271 | 1,474 | 1,436 | 1,611 | 1,566 | 1,571 | 1,592 | 1,463 | 1,530 | 1,473 | 1,460 |
| 2019 | 1,342 | 1,240 | 1,463 | 1,485 | 1,558 | 1,485 | 1,590 | 1,565 | 1,453 | 1,528 | 1,443 | 1,440 |
| 2020 | 1,327 | 1,298 | 1,257 | 948 | 1,208 | 1,375 | 1,419 | 1,407 | 1,316 | 1,370 | 1,229 | 1,263 |
| 2021 | 1,184 | 1,094 | 1,381 | 1,418 | 1,531 | 1,522 | 1,556 | 1,550 | 1,440 | 1,478 | 1,419 | 1,408 |
| 2022 | 1,263 | 1,197 | 1,467 | 1,463 | 1,583 | 1,566 | 1,541 | 1,588 | 1,504 | 1,535 | 1,447 | 1,430 |
| 2023 | 1,364 | 1,302 | 1,475 | 1,460 | 1,569 | 1,540 | 1,518 | 1,532 | 1,394 | 1,462 | 1,415 | 1,374 |
| 2024 | 1,253 | |||||||||||
| - = No Data Reported; -- = Not Applicable; NA = Not Available; W = Withheld to avoid disclosure of individual company data. |
| Release Date: 3/29/2024 |
| Next Release Date: 4/30/2024 |